The multivariate comparison module examines the relationship between a pair of associated variables that measure:
- Different but physically related quantities, e.g., SW_IN vs PPFD_IN, USTAR vs WS, TA vs T_SONIC.
- The same quantity at different locations or using different sensors, e.g., vertical air temperature (TA) profile and replicates (not implemented yet).
The associated variables are expected to have a consistent or predictable relationship with each other over time.
Based on the occurrence frequency of outliers to the expected relationship, the following issues can be identified:
- Outlier (sporadically flagged)
- Variables not synchronized in time (excessive scattering)
- Step change in full range (flagged for a specific time period)
- Trend (systematic change in the regression slope)
- Short-term mismatch (flagged for a specific time period)
- Shaded radiation (periodically flagged)
- Derived one from another (perfectly fit)
Module Design
The module fits a linear regression (model II) between the two targeted variables over each year and the full data record. Data points that have relatively large deviations from the regression line are flagged as possible outliers. The percentages of flagged points in each year and the entire record are used to determine if a variable has excessive out-of-range data points:

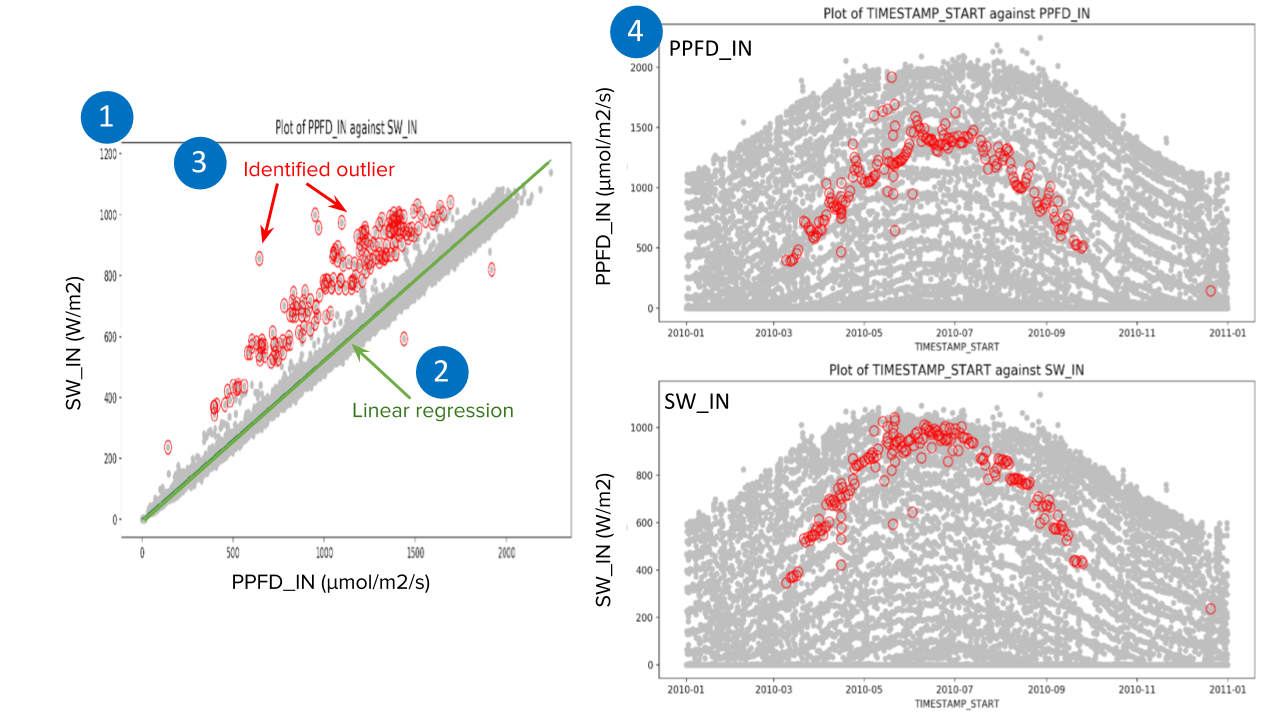
Example figure illustrating the multivariate comparison in a year. The right panel (4) shows a one-year time series of PPFD_IN and SW_IN. The left panel (1) shows the scatter plot of SW_IN and PPFD_IN from the same one-year period. The green line denotes the linear regression generated from all data (2), while the red, highlighted circles denote data points that are flagged as outliers based on distance from the regression line (3). The periodic occurrence of flagged outliers suggests one of the radiation sensors, PPFD_IN in this case, is shaded periodically when the other sensor is not in the shade.
For variables that are provided for more than one year, the module also examines the year-to-year changes in the annual regression slopes. Potentially, any change of the regression slopes over the years could indicate a trend or a step-change in the full range of a variable:

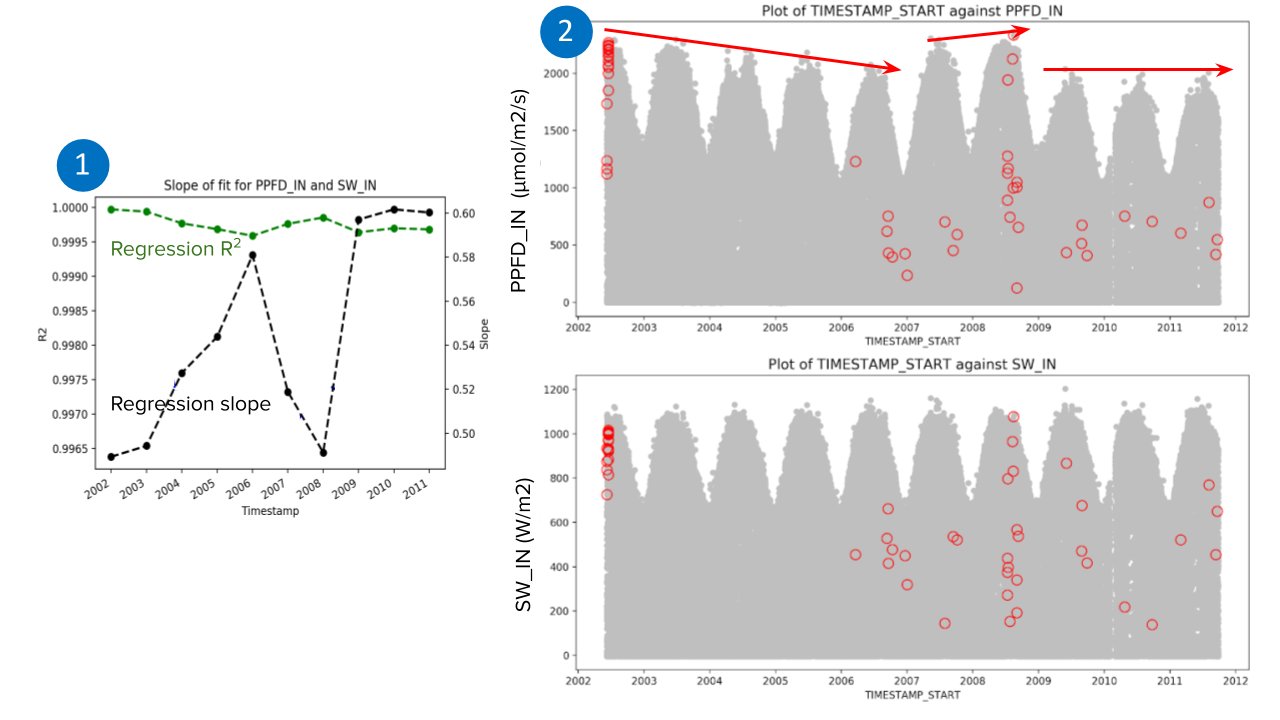
Example figure illustrating the multivariate comparison over multiple years. The right panel (2) shows a 10-year time series of PPFD_IN and SW_IN. The left panel (1) shows the time series of regression slopes and R2, calculated between PPFD_IN and SW_IN in each year (as shown in the previous figure). The changes of regression slopes over the years suggest one of the radiation sensors, PPFD_IN in this case, has a shifted full range over the years (red arrows) as compared with the other sensor.
