
The physical range module examines the full range and temporal pattern of the target variable. The module assesses all variables. While the module is mainly designed to detect out-of-range data points, additional issues, like trend and step-change, can be identified through manual inspection of the time-series figures.
The module can be used to identify the following issues:
- Plausibility check
- Outlier (i.e., out-of-range) points
- Percentage-ratio check (i.e., percentages provided as ratios)
- Variability check
- Trend
- Step-change
- Repeating patterns and/or Filled constants
- Measurement and/or Processing cut-off
- Other unrecognized patterns
- Resolution check
- Change of measurement resolution
- Change of temporal resolution
Module Design
For each variable, the accepted range is defined based on its physically plausible range, for example 0-100 for percentage variables, and/or the distribution of the published data across the AmeriFlux sites. A ±5% buffer is applied to account for possible edge values near the lower and upper bounds, which are commonly observed for radiation variables, relative humidity, and snow depth. Data values are flagged as:
- WARNING if outside the expected physical range, but within the buffer range (±5% of physical range)
- ERROR if outside the expected physical range plus the buffer range.
The percentages of flagged points in each year and in the entire record are used to determine if a variable has excessive out-of-range data points.
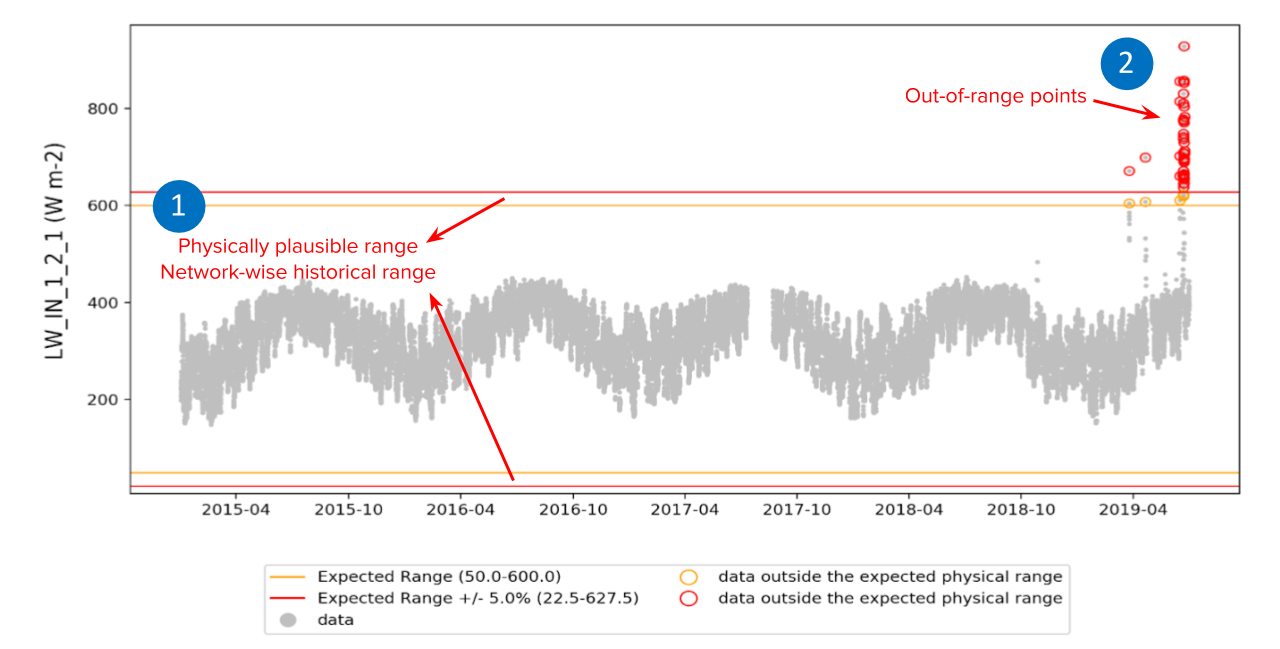
Example figure illustrating the physical range module. (1) The yellow lines indicate the accepted range defined based on the physically plausible range and/or the reported network-wide historical range. The red lines indicate the accepted range plus a 5% buffer range. (2) The out-of-range data points (highlighted by red or yellow circles) are detected based on the accepted range.
The physical range module can identify trends or step changes via manual inspection. A quantitative metric is under development.
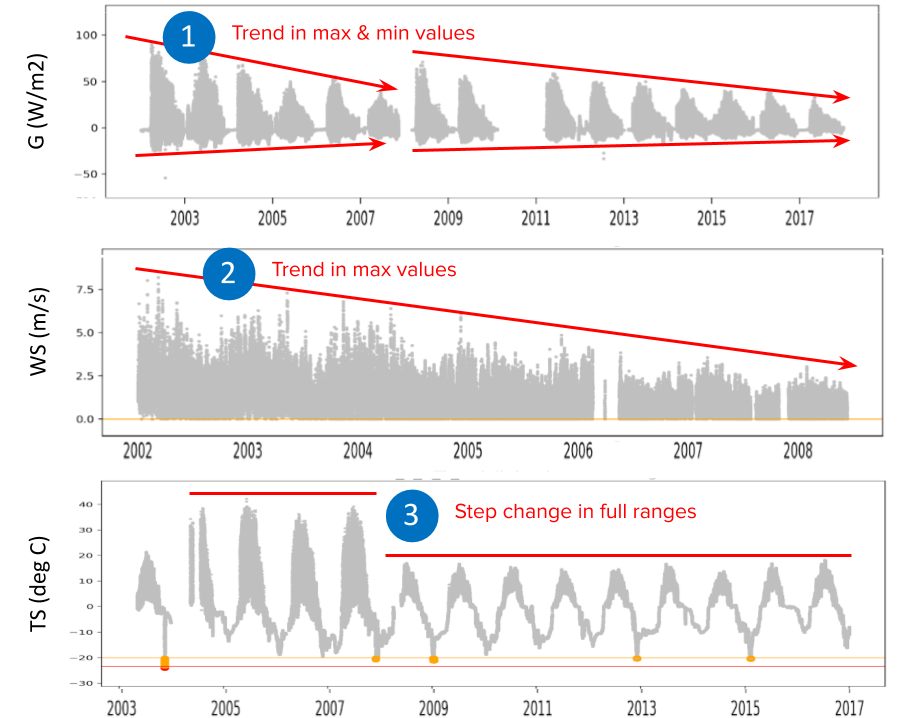
Example figure illustrating issues detected via manual inspection: (1) trends in both the maximum and minimum values; (2) trend in the maximum values; and (3) a step-change in the full ranges.