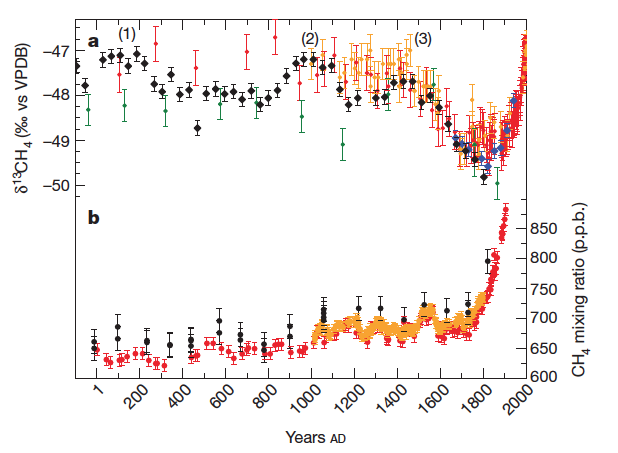
This image shows steep increases in atmospheric methane at the beginning of the Industrial Revolution in the 18th century. Records of δ13C and mixing ratio of CH4 over the past two millennia. (a) δ13C measurements on air trapped in Greenland ice cores from NEEM (black diamonds), EUROCORE (blue diamonds), GISPII23 (green diamonds) and Antarctic ice cores from Law Dome1 (red diamonds) and the WAIS divide2 (orange diamonds). (1), (2) and (3) correspond to the three excursions in the Northern Hemisphere δ13C record. (b) CH4 mixing ratio records from Greenland (GRIP5, 6; black circles) and Antarctica (Law Dome4, red circles; WAIS7, orange circles). Each data point represents one measurement. Error bars represent ±1σ, based on the reproducibility of the measurement systems. Figure 1 from Sapart et al. 2012.