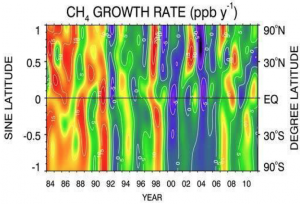
The warmer colors (yellow, orange) indicate periods of higher-than average growth rate and the cooler colors (blue, purple) indicate periods of lower growth rate. The CO2 growth rate varies from year to year with a higher growth rates since 2000. The CH4 growth rate slowed during the 1990s. Global CH4 was relatively stable in the early 2000s, but growth is back since 2007. From NOAA Global Monitoring 2013-2017 Division Review 2018.


