
US-Jo2: Jornada Experimental Range Mixed Shrubland
- Overview
- Windroses
- Data Citation
- Data Use Log
- Image Gallery
- Remote Sensing Data
- MODIS
- PhenoCam
- GeoNEX
- Publications
- BADM
| Tower_team: | |
| PI: | Enrique R. Vivoni vivoni@asu.edu - Arizona State University |
| FluxContact: | Eli R. Perez-Ruiz eli.perez@uacj.mx - Universidad Autonoma de Ciudad Juarez |
| Lat, Long: | 32.5849, -106.6032 |
| Elevation(m): | 1469 |
| Network Affiliations: | AmeriFlux, LTER |
| Vegetation IGBP: | OSH (Open Shrublands: Lands with woody vegetation less than 2 meters tall and with shrub canopy cover between 10-60%. The shrub foliage can be either evergreen or deciduous.) |
| Climate Koeppen: | Bwk (Desert: very cold winter) |
| Mean Annual Temp (°C): | 17.5 |
| Mean Annual Precip. (mm): | 282.3 |
| Flux Species Measured: | CO2, H, H2O |
| Years Data Collected: | 2010 - Present |
| Years Data Available: | AmeriFlux BASE 2010 - 2020 Data Citation AmeriFlux FLUXNET 2010 - 2020 Data Citation |
| Data Use Policy: | AmeriFlux CC-BY-4.0 Policy1 |
| Description: | |
| URL: | http://hydrology.asu.edu/wiki/index.php |
| Research Topics: | Watershed hydrology and ecohydrology |
| Acknowledgment: | Funding for the operation and maintenance of the Jornada Experimental Range Mixed Shrubland was provide by the NSF LTER Program (NSF Grant DEB-1235828) and the US Army Research Office (grant 56059‐EV‐PCS). |
- This site’s data can also be used under the more restrictive AmeriFlux Legacy Policy.
The AmeriFlux Legacy Policy must be followed if this site’s data are combined with data from sites that require the AmeriFlux Legacy Policy.
Copyright preference: As long as credit is given
US-Jo2: Jornada Experimental Range Mixed Shrubland
- Overview
- Windroses
- Data Citation
- Data Use Log
- Image Gallery
- Remote Sensing Data
- MODIS
- PhenoCam
- GeoNEX
- Publications
- BADM
Use the information below for citation of this site. See the Data Policy page for more details.
DOI(s) for citing US-Jo2 data
Data Use Policy: AmeriFlux CC-BY-4.0 License
This site’s data can also be used under the more restrictive AmeriFlux Legacy Policy.
The AmeriFlux Legacy Policy must be followed if US-Jo2 data are combined with data from sites that require the AmeriFlux Legacy Policy.
- AmeriFlux BASE: https://doi.org/10.17190/AMF/1617696
Citation: Enrique R. Vivoni, Eli R. Perez-Ruiz (2022), AmeriFlux BASE US-Jo2 Jornada Experimental Range Mixed Shrubland, Ver. 2-5, AmeriFlux AMP, (Dataset). https://doi.org/10.17190/AMF/1617696 - AmeriFlux FLUXNET: https://doi.org/10.17190/AMF/1881584
Citation: Enrique R. Vivoni, Eli R. Perez-Ruiz (2024), AmeriFlux FLUXNET-1F US-Jo2 Jornada Experimental Range Mixed Shrubland, Ver. 4-6, AmeriFlux AMP, (Dataset). https://doi.org/10.17190/AMF/1881584
Find global FLUXNET datasets, like FLUXNET2015 and FLUXNET-CH4, and their citation information at fluxnet.org.
To cite BADM when downloaded on their own, use the publications below for citing site characterization. When using BADM that are downloaded with AmeriFlux BASE and AmeriFlux FLUXNET products, use the DOI citation for the associated data product.
Publication(s) for citing site characterization
- —
Acknowledgments
- —
Resources
- AmeriFlux Logos & Acknowledgments
US-Jo2: Jornada Experimental Range Mixed Shrubland
- Overview
- Windroses
- Data Citation
- Data Use Log
- Image Gallery
- Remote Sensing Data
- MODIS
- PhenoCam
- GeoNEX
- Publications
- BADM

This page displays the list of downloads of data for the site {{siteId}}.
Note: Results are the number of downloads to distinct data users. The Download Count column indicates the number of times the data user downloaded the data. The Version column refers to the version of the data product for the site that was downloaded by the data user.
| Date | Name | Data Product | Vers. | Intended Use | Intended Use Description | Download Count |
|---|---|---|---|---|---|---|
| {{dlObject.timeStamp}} | {{dlObject.displayName}} | {{displayProduct(dlObject.dataProduct)}} | {{dlObject.version}} | {{dlObject.intendedUse}} | {{dlObject.comment}} | {{dlObject.downloadCounter}} |
Showing {{startItem + 1}} to {{(startItem + items) > filtered.length ? filtered.length : (startItem + items)}} of {{filtered.length}} results
Showing 0 to 0 of 0 results
Not Found
Uh Oh. Something is missing. Try double checking the URL and try again.
US-Jo2: Jornada Experimental Range Mixed Shrubland
- Overview
- Windroses
- Data Citation
- Data Use Log
- Image Gallery
- Remote Sensing Data
- MODIS
- PhenoCam
- GeoNEX
- Publications
- BADM
| AmeriFlux Images | Add Image |
 US-Jo2
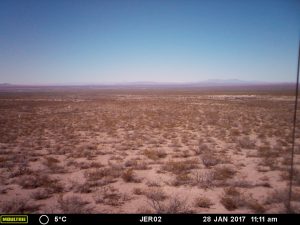
 Piedmont View
East view of the the eddy covariance tower installed in a mixed shrubland of the Chihuahuan desert located in the piedmont of the San Adreas Mountains in the Jornada Experimental Range.
Keywords: Jornada Experimental Range, Mixed Shrubland, Chihuahua Desert
Location: New Mexico, United States
View in Original Size
To download, right-click photo (Mac: control-click) and choose Save Image As
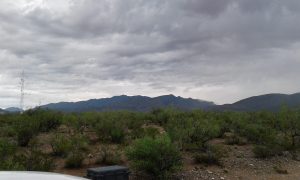
US-Jo2 West view of the US-Jo2 Site
West view of the small first-order watershed from the top of the eddy covariance tower installed in a mixed shrubland of the Chihuahuan desert located in the piedmont of the San Adreas Mountains in the Jornada Experimental Range.
Keywords: Jornada Experimental Range, Mixed Shrubland, Chihuahua Desert
Location: New Mexico, United States
View in Original Size
To download, right-click photo (Mac: control-click) and choose Save Image As
US-Jo2: Jornada Experimental Range Mixed Shrubland
- Overview
- Windroses
- Data Citation
- Data Use Log
- Image Gallery
- Remote Sensing Data
- MODIS
- PhenoCam
- GeoNEX
- Publications
- BADM
| AmeriFlux Publications | Add Publication |
| Year | Publication |
|---|---|
| 2022 | Pérez‐Ruiz, E. R., Vivoni, E. R., Sala, O. E. (2022) Seasonal Carryover Of Water And Effects On Carbon Dynamics In A Dryland Ecosystem, Ecosphere, 13(7), . https://doi.org/https://doi.org/10.1002/ecs2.4189 |
| 2016 | Mascaro, G., Vivoni, E. R. (2016) On The Observed Hysteresis In Field-Scale Soil Moisture Variability And Its Physical Controls, Environmental Research Letters, 11(8), 084008. https://doi.org/https://doi.org/10.1088/1748-9326/11/8/084008 |
| 2018 | Biederman, J. A., Scott, R. L., Arnone III, J. A., Jasoni, R. L., Litvak, M. E., Moreo, M. T., Papuga, S. A., Ponce-Campos, G. E., Schreiner-McGraw, A. P., Vivoni, E. R. (2018) Shrubland Carbon Sink Depends Upon Winter Water Availability In The Warm Deserts Of North America, Agricultural And Forest Meteorology, 249, 407-419. https://doi.org/https://doi.org/10.1016/j.agrformet.2017.11.005 |
| 2020 | Schreiner-McGraw, A. P., Vivoni, E. R., Ajami, H., Sala, O. E., Throop, H. L., Peters, D. P. (2020) Woody Plant Encroachment Has A Larger Impact Than Climate Change On Dryland Water Budgets, Scientific Reports, 10(1), . https://doi.org/https://doi.org/10.1038/s41598-020-65094-x |
| 2018 | Schreiner‐McGraw, A. P., Vivoni, E. R. (2018) On The Sensitivity Of Hillslope Runoff And Channel Transmission Losses In Arid Piedmont Slopes, Water Resources Research, 54(7), 4498-4518. https://doi.org/https://doi.org/10.1029/2018WR022842 |
| 2017 | Schreiner-McGraw, A. P., Vivoni, E. R. (2017) Percolation Observations In An Arid Piedmont Watershed And Linkages To Historical Conditions In The Chihuahuan Desert, Ecosphere, 8(11), e02000. https://doi.org/https://doi.org/10.1002/ecs2.2000 |
| 2016 | Schreiner-McGraw, A. P., Vivoni, E. R., Mascaro, G., Franz, T. E. (2016) Closing The Water Balance With Cosmic-Ray Soil Moisture Measurements And Assessing Their Relation To Evapotranspiration In Two Semiarid Watersheds, Hydrology And Earth System Sciences, 20(1), 329-345. https://doi.org/https://doi.org/10.5194/hess-20-329-2016 |
| 2016 | Anderson, C. A., Vivoni, E. R. (2016) Impact Of Land Surface States Within The Flux Footprint On Daytime Land-Atmosphere Coupling In Two Semiarid Ecosystems Of The Southwestern U.S., Water Resources Research, 52(6), 4785-4800. https://doi.org/https://doi.org/10.1002/2015WR018016 |
| 2014 | Templeton, R. C., Vivoni, E. R., Méndez-Barroso, L. A., Pierini, N. A., Anderson, C. A., Rango, A., Laliberte, A. S., Scott, R. L. (2014) High-Resolution Characterization Of A Semiarid Watershed: Implications On Evapotranspiration Estimates, Journal Of Hydrology, 509, 306-319. https://doi.org/https://doi.org/10.1016/j.jhydrol.2013.11.047 |
US-Jo2: Jornada Experimental Range Mixed Shrubland
- Overview
- Windroses
- Data Citation
- Data Use Log
- Image Gallery
- Remote Sensing Data
- MODIS
- PhenoCam
- GeoNEX
- Publications
- BADM
BADM for This Site
Access the Biological, Ancillary, Disturbance and Metadata (BADM) information and data for this site.
BADM contain information for many uses, such as characterizing a site’s vegetation and soil, describing disturbance history, and defining instrumentation for flux processing. They complement the flux/met data.
- Download BADM for this site*
- View Site General Info for this site (Overview tab)*
- Use Online Editor to update Site General Info or DOI Authorship
- Update information about submitted data (Variable Information tool)
- More BADM resources
* Online updates are shown on the Overview tab real time. However, downloaded BADM files will not reflect those updates until they have been reviewed for QA/QC.
US-Jo2: Jornada Experimental Range Mixed Shrubland
- Overview
- Windroses
- Data Citation
- Data Use Log
- Image Gallery
- Remote Sensing Data
- MODIS
- PhenoCam
- GeoNEX
- Publications
- BADM
Wind Roses
Wind Speed (m/s)
- Wind Speed Scale: Per Site
- Wind Direction Scale (%): Per Site
- Wind Speed Scale: Non-Linear
- Wind Direction Scale (%): AmeriFlux