
Species-level insights from ecosystem-scale phenology monitoring
Many Ameriflux towers are equipped with PhenoCam network cameras that take digital images every half hour throughout the day. These images allow for long-term records of phenological dynamics that are more objective than what can be obtained from human observations, and permit automated observation of the timing of the emergence of new vegetation, canopy development throughout the growing season, and senescence in autumn. This robust collection of images, across many different ecosystems, improves our understanding of interannual variability in phenological timing in vegetation at the ecosystem scale and is a biological indicator of environmental change. For these reasons, PhenoCam network data have undeniably transformed our understanding of the links between carbon/water cycling and phenological change at the ecosystem scale. However, these images have yet to be harnessed to improve our understanding of species-level variability in phenological timing – until now. At US-MMS, we employed a novel approach to identifying individual tree canopies and their species which populate the foreground of the PhenoCam images. This was made possible by the use of brightly colored mylar balloons which were attached to tree canopies with the aid of a Boom-lift, operated by Daniel Beverly (Fig 1). The balloons were tied to known tree canopies within the camera viewshed and were utilized to identify ~20 individual canopies in the foreground of the PhenoCam.
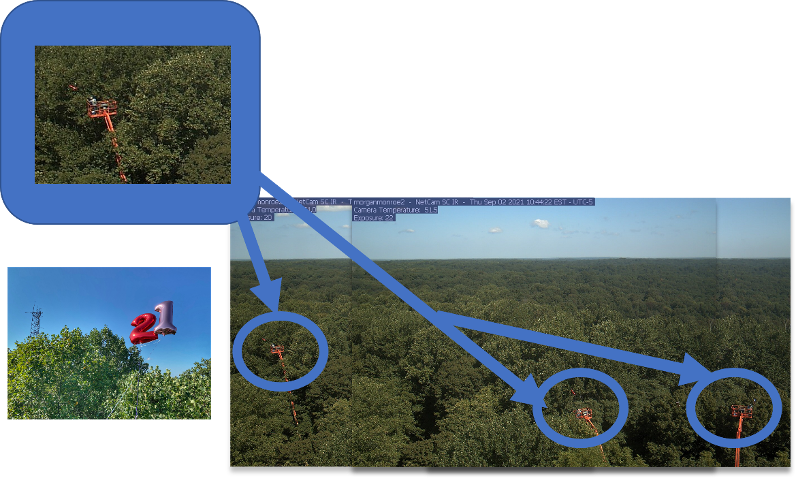
Figure 1. Daniel Beverly in the boom-lift, attaching mylar balloons to tree canopies (while also installing psychrometers and taking leaf-level gas exchange measurements. The standard view of the Phenocam is repeated, showing the boom-lift in different parts.
By identifying individual canopies in the PhenoCam images, we were able to go back in time to determine various phenophases of these known individual trees by fitting a double logistic model to the seasonal trend of the green chromatic coordinate (GCC) for each newly created region of interest (ROI) in the image. We then could compare variability in the start of season (SoS) within and across species for the PhenoCam record (Fig. 2, 2009-2021) and to explore the extent the SoS of each species deviates from the SoS when considering only the full view (ecosystem scale).
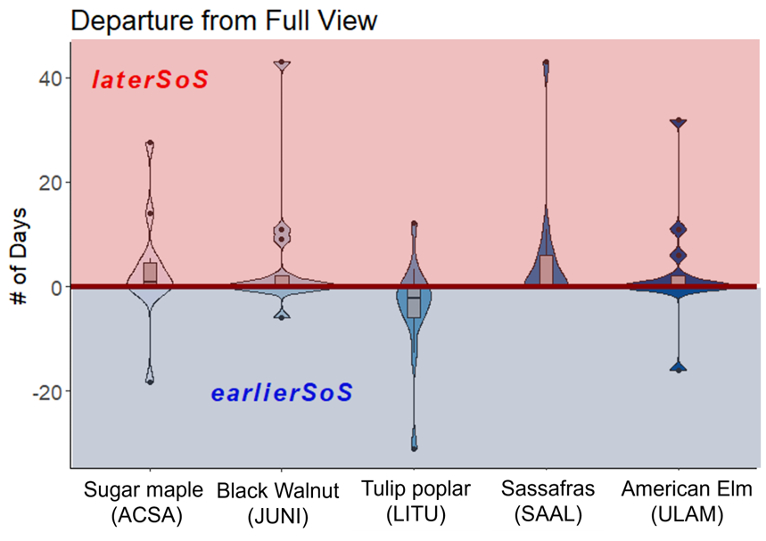
Figure 2. Variability in start of season (SoS) across dominant tree species from 2009-2022. Tulip poplars consistently leaf out earlier than cohabitating species.
We were also able to capture a late frost event and quantify which species were most affected. While it can be advantageous from a carbon uptake perspective for leaves to emerge earlier in the season due to optimal conditions, this increases the risk of late-season frost damage. For US-MMS in the spring of 2021, tulip poplars (Liriodendron tulipifera) capitalized on some early spring warm temperatures and their leaves emerged earlier than other co-dominant species (e.g., Acer saccharum, Ulnas americana, Sassafras albidum, Juglans nigra). When the frost came in mid-April, all the tulip poplars, at least those in the Phenocam images, shed their freshly emerged vegetation (Fig 3).
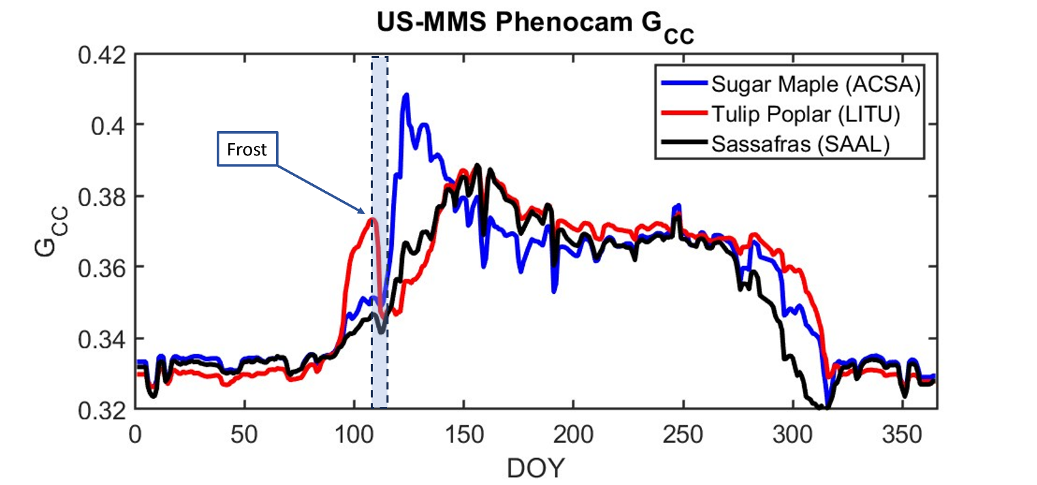
Figure 3. Timeseries of Gcc derived from Phenocam images in 2021. Due to the propensity of tulip poplars to leaf out early if conditions are suitable, they are more at risk to suffer the consequences of a late-season frost, which occurred in 2021 around DoY 110.
Fortunately, the tulip poplars were able to recover to near-peak greenness (as measured by GCC), and when evaluating the overall CO2 uptake that year, it was not significantly different from any other year, so it appears that this did not cause a decrease in carbon uptake, even with the leaf damage. The GCC data were validated with our ground-based phenology records, a true Novick Lab team effort including undergraduate, graduate, and postdoctoral support, and includes observations of ~120 individual trees spanning a variety of species within the footprint of the flux tower. Through this endeavor, we have begun our journey of truly seeing the trees through the forest. The results shown here have been incorporated into Sander Denham’s dissertation work, which focused on understanding the connections between phenological timing in spring and the development of soil moisture deficits in the fall. Undergraduate Tracy Mai will be using these data and approaches to inform her senior thesis, which will be completed in Spring of 2024. Tracy is particularly interested in the species-level coordination of spring and fall phenological timing.
Note from the editor:
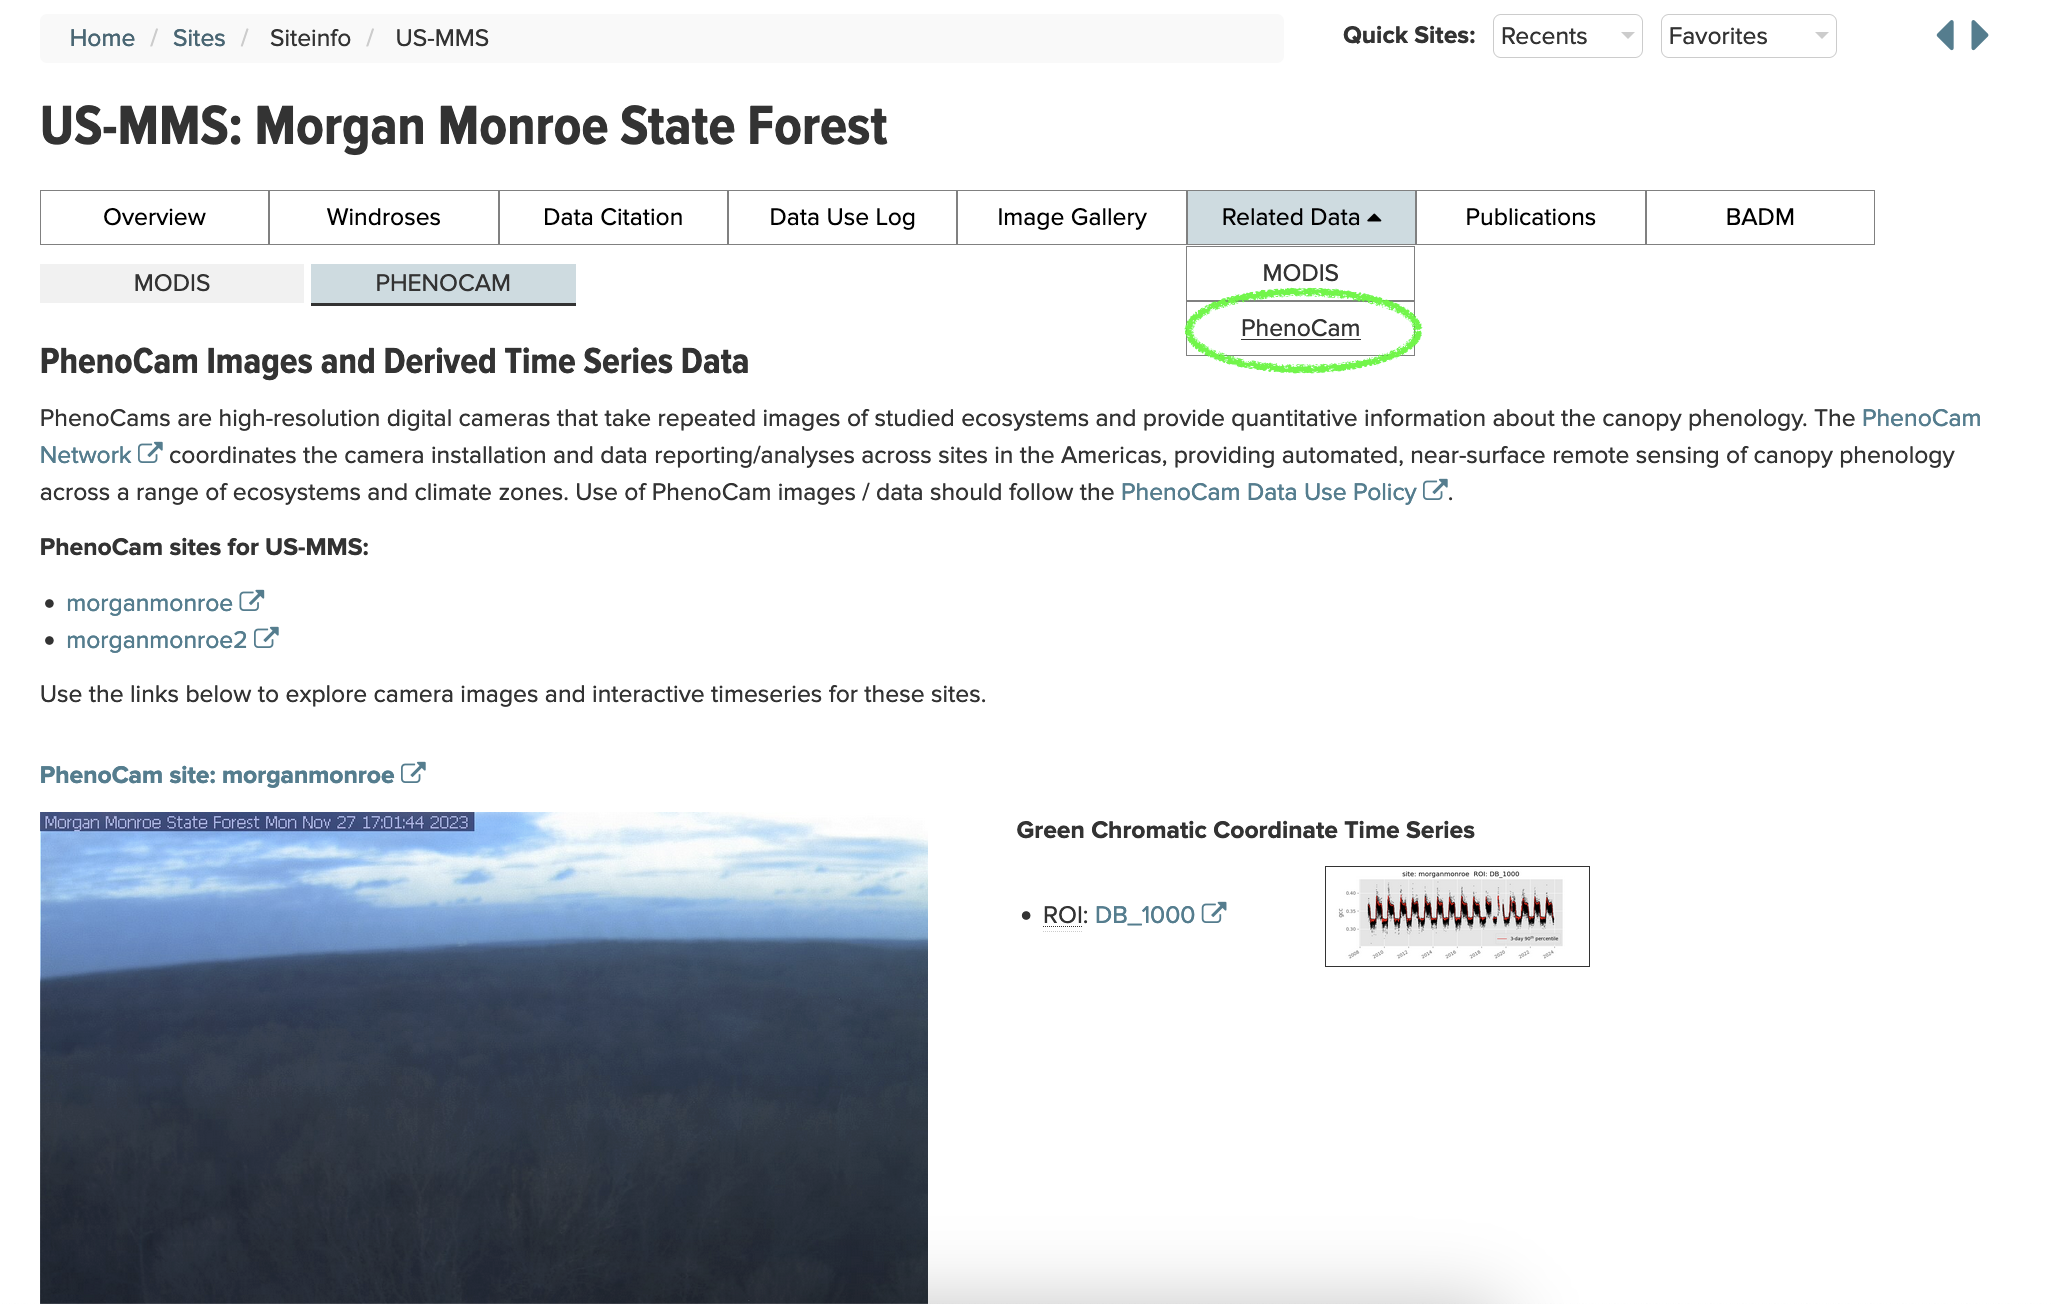
This wonderful post from the US-MMS AmeriFlux Core site beautifully demonstrates what can happen when eddy covariance flux data and phenocam data are combined for new insights! To facilitate exploration of existing datasets, the site info pages on AmeriFlux now feature a brand new Phenocam tab. If a site registered in AmeriFlux is also member of the Phenocam network, this tab (found under Related Data) will give a preview of the phenocam image and the GCC time series, and provide links to retrieve data directly from Phenocam. Give it a try!
No Comments
Be the first to start a conversation