
Wetlands are an important component of the New England landscape, the Harvard Forest has its share; about 25% of the landscape is classified wetland or very poorly drained. Except for tidal wetlands on the coast, many are small basins with deep organic sediment or peat layers that accumulated as glacial ponds filled in over the past several thousand years. Due to human alteration of the hydrology by dam building and drainage, and more recently recolonization by beavers these wetlands are hydrologically dynamic. A roughly 250x100m wetland along the Bigelow Brook to the northwest of the Harvard EMS flux tower (US-Ha1) has long been of particular interest. Anecdotally, we suspected wetland processes for occasional anomalies in the CO2 fluxes when winds were from the NW, but had no quantitative evidence to support this. Initially this wetland had live trees and its water table was below the surface most of the time. However, in 2001 beavers dammed Bigelow Brook and flooded the swamp. Three of our biometry plots were abandoned when the trees died and the sites were inaccessible. Water levels in the wetland have varied drastically as the beavers abandoned the dam, tried again and subsequently gave up on the site. Water levels have dropped enough that shrubs and marsh grasses are regrowing, but the water table is still at or near the surface for much of the year.
In January 2021, a group of investigators associated with the Harvard Forest LTER met to discuss the role of wetlands in carbon dynamics at the site and across the regional landscape. Motivated by this discussion we made plans for a temporary study to measure CO2 and CH4 fluxes from the Bigelow Brook Beaver swamp. The preliminary data would become the basis for seeking additional funding to establish a more permanent wetland site if we observed significant CH4 emissions, or CO2 flux dynamics that diverged from the upland forest fluxes. Alternatively, the results could put to rest questions about whether this wetland had a significant impact on the flux-tower observations.
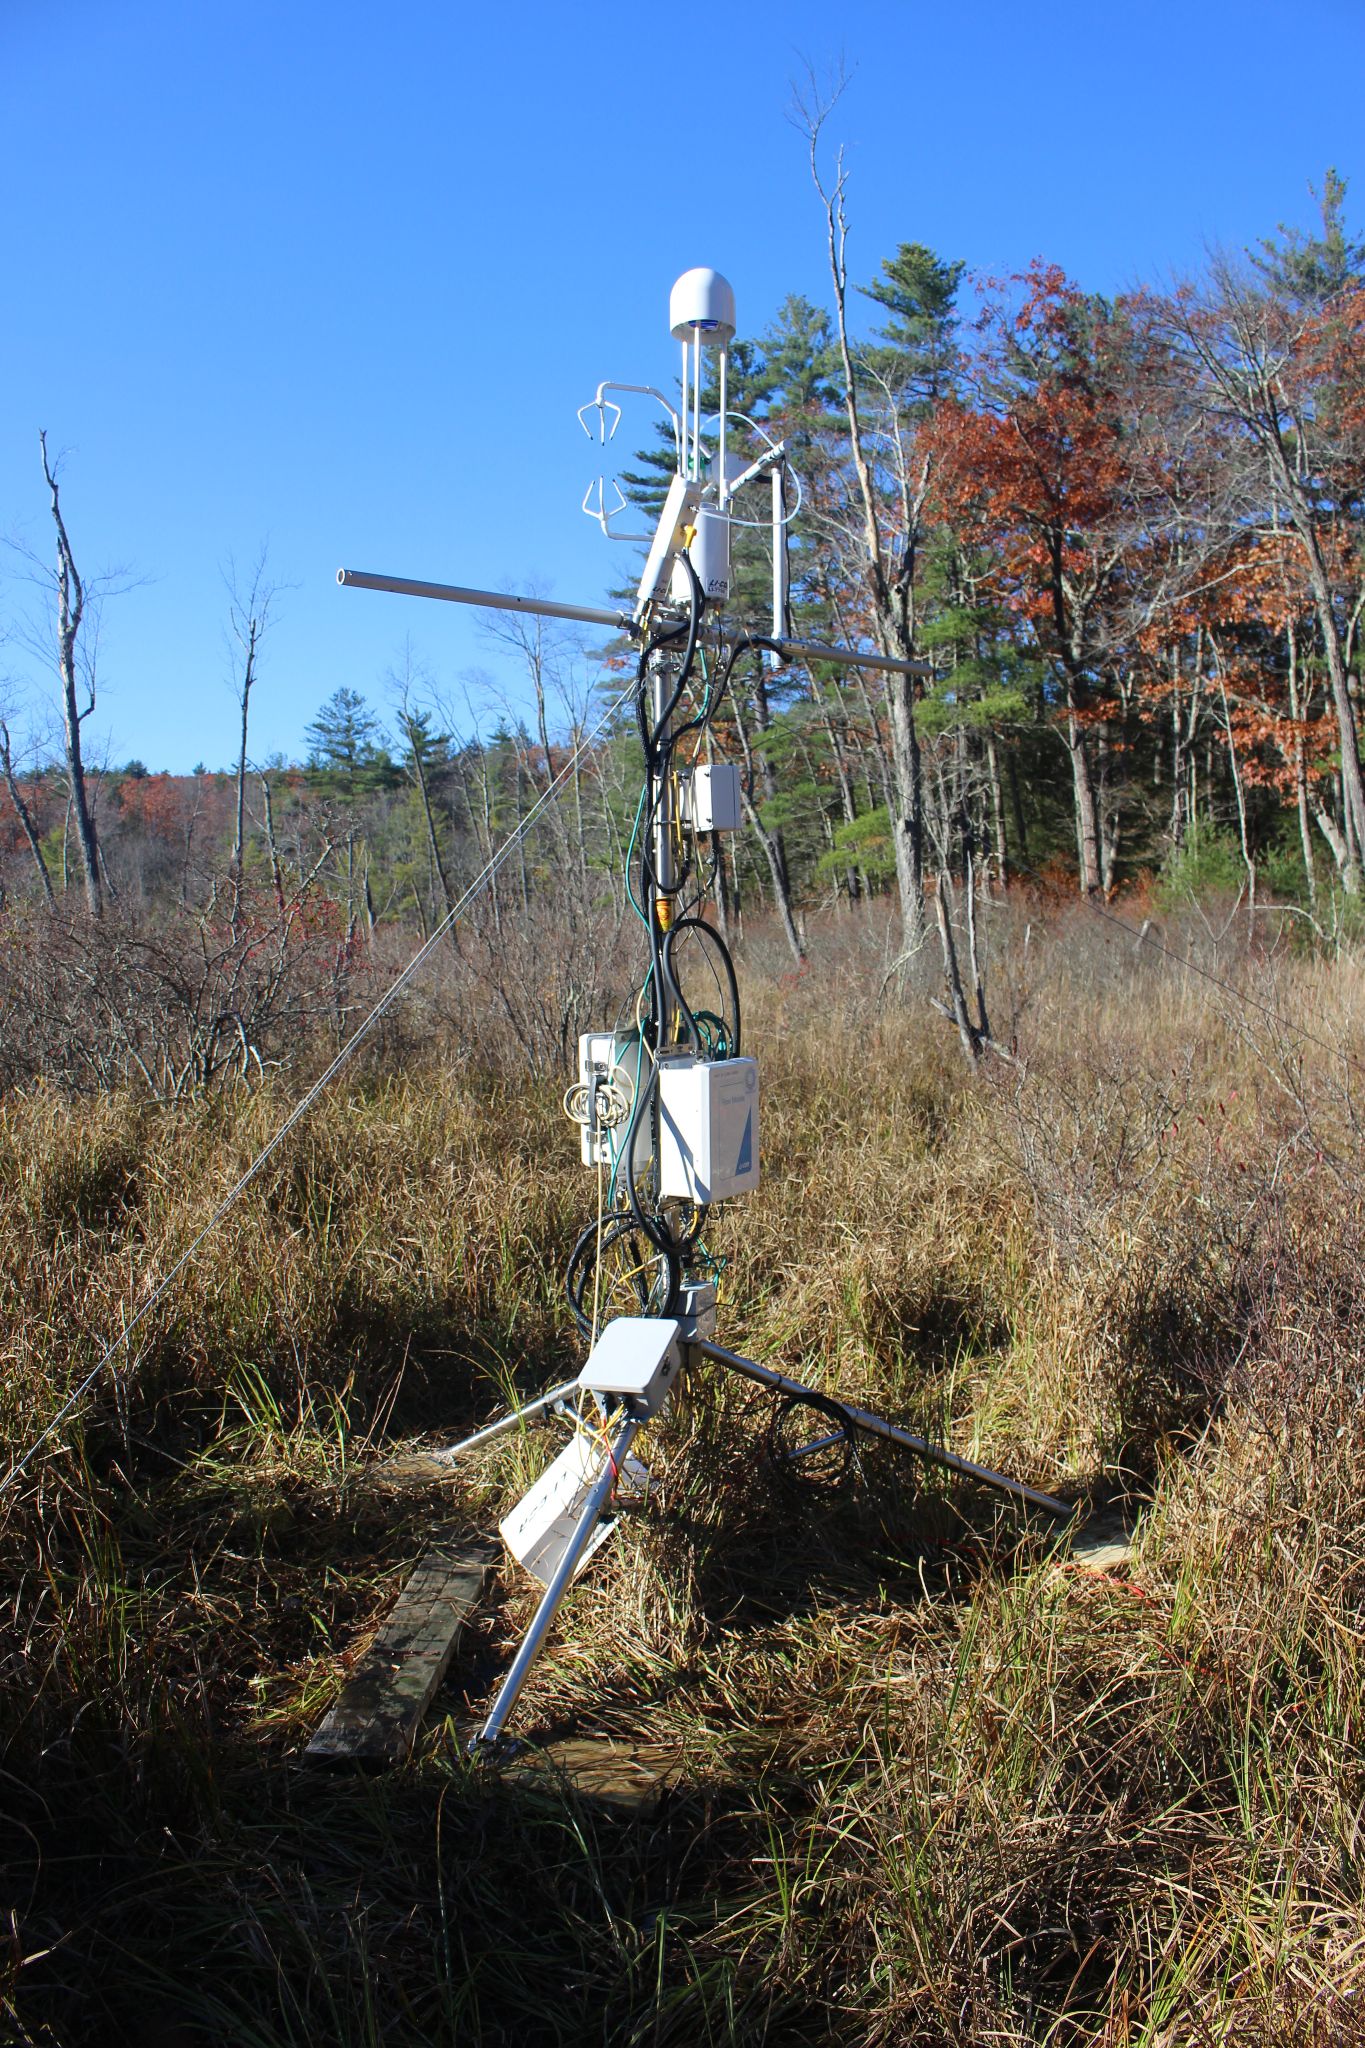
Figure 1 View of the Swamp site tower with CH4 and CO2 analyzers, and sonic anemometer. Note the remaining standing dead trees that were present before the 2001 flooding, and dense regrowing shrubs nearby.
The AmeriFlux instrument loaner program provided a LI-7200 and LI-7700 gas analyzer to use for this pilot study. We already had a Campbell CSAT anemometer and tripod tower from other projects. It took most of the summer to configure the infrastructure to support the measurements including several hundred meters of power and data cables (Figure 1). We commenced measurements on October 21, 2022. The CH4 measurements ended on December 15, 2022 when it became too cold to operate the LI-7700 open-path analyzer but the enclosed-path LI-7200 CO2/H2O analyzer remained in operation. From a first look at the data we can say that yes the swamp does emit some methane. Nighttime emissions average nearly 10 nmole m-2s-1, but frequent periods of CH4 uptake during the middle of the day generate an average uptake of nearly 20 nmole m-2s-1for a few hours around noon (Figure 2). Over the Oct 21 – December 15 interval CO2 fluxes were roughly 1.5 µmol m-2s-1 at night, and 0 around noon when CO2 uptake offset the respiration mainly in the early days of the period before all the vegetation senesced. Over the coming months we will be analyzing the data and making plans for extending the measurements to capture at least a full annual cycle. Once we have finished the quality checks, the data will be added to AmeriFlux database. Having access to instrument loans has been essential for obtaining preliminary data before committing resources to setting up a more permanent installation.
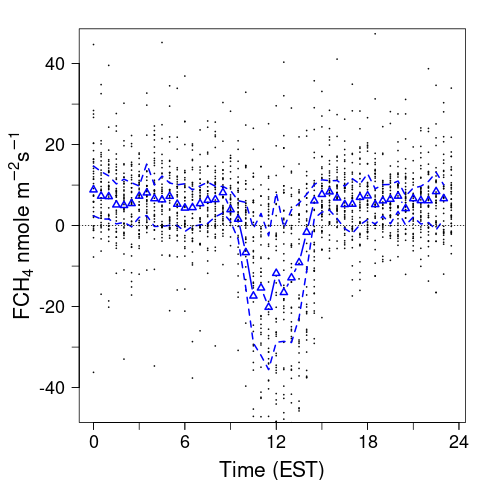
Figure 2 Mean diel cycle of CH4 flux for the period Oct. 21 – Dec. 15, 2022. Individual observations are shown by dots, the solid line is mean and dashed lines are the 25 and 75 percentiles.
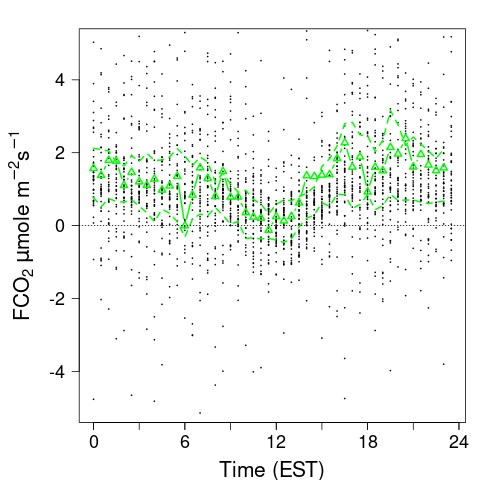
Figure 3. Mean diel cycle of CO2 flux for the period Oct. 21 – Dec. 15, 2022. Individual observations are shown by dots, the solid line is mean, and dashed lines are the 25 and 75 percentiles.
No Comments
Be the first to start a conversation