

Daphne Szutu
In September 2020, the Ameriflux Management Project Tech Team hosted a panel discussion on best practices for collecting flux observations. The first topic of discussion focused on techniques to ensure high-quality data and to minimize data gaps. High-quality data means accurate, precise, and continuous observations with no large data gaps. High-quality data provides a richer dataset from which we can make insightful interpretations with less uncertainty. As lead panelist Russ Scott emphasized, take pride in collecting the highest quality data you can because you can’t go back in time to fix a problem.
Here are two approaches that can help you collect high-quality data and minimize data gaps: automate data visualization for post-visit data QA/QC, and take advantage of digital notes for field work and data processing.
Check your data early and often – automate data visualization
High-quality data depends on checking your data early and often. Honestly, it can be time consuming to do this task after every site visit or remote data download. If you find yourself going through a convoluted series of steps to check your data, you will not do it often (enough). Instead, put in the time early-on to automate your data QA/QC process. If you can make it easy on yourself to check your data, you will do it often. Frequent data checking will greatly help you produce high-quality data with minimal data gaps.
At our flux sites, our data QA/QC strategy is to automate data visualization. The key is to generate informative plots with the fewest possible steps. A great first step is to write a simple script that plots the most useful data columns as a time-series figure. It doesn’t have to be fancy. You can also add 1:1 plots of variables that act as reasonable proxies, such as data from pyranometer and PAR sensors.
More graphs are not necessarily better, either. There is a balance between too few graphs and too many graphs: if you have too few graphs and only plot CO2 and CH4 fluxes but don’t plot CO2 signal strength and CH4 RSSI, then you may miss deleterious decreases in signal strengths. This is what happened to me in grad school – I lost several months of flux data over the summer from our semi-arid creosote site because I didn’t check the CO2 signal strength. When I finally set up a ladder to check the sensor at the end of summer, there was one big splat of old bird poop covering the lower window of the LI-7500 sensor head. On the other hand, if you’re plotting every single column, trying to sort through too many graphs may be overwhelming and you may miss something simple. For example, you probably don’t need to check CH4 sensor temperature and pressure data every time if you have redundant temperature and pressure measurements.
Our lab uses MATLAB scripts and an in-house website for our data visualization. Simple scripts could be written in any language of choice (Python, R, …). If you’re downloading data remotely, Campbell Scientific LoggerNet also has tools for real-time and historical data plotting. Jonathan Thom of the ChEAS Core Site Cluster (Chequamegon Ecosystem-Atmosphere Study) wrote an informative blog post about using influxDB and Grafana for real-time data viewing after using LoggerNet Linux to collect data from their stations. If the community has other recommendations for easy data visualization tools, please share them in the comment section of this blog.
Beyond data visualization, you can also write scripts to calculate data statistics as a quick check. Our scripts check for minimum, maximum, and variance of selected variables, and will flag a variable if these statistics are outside of the expected bounds. We check for large variance because an unmoving value or a noisy signal from a broken sensor can still be within its expected range. We once found a typo in our data acquisition script where we were measuring soil moisture sensors every 10 hours instead of every 10 minutes.
Finally, beyond the data itself, you can also keep an eye on (or write a script to automatically flag) the number of files, the number of records per file, and the file sizes to make sure they are within expectations. For example, every 2 weeks when I visit our sites, I should be downloading about 600 lines of half-hourly data. If I only see 400 lines of data coming in, I know something is wrong.

An automatically generated plot of CH4 and RSSI (signal strength) from our LI-7700 gas analyzer. From a glance, we can see that the RSSI has been steadily decreasing with time and that something is wrong with the LI-7700 autowash. In this case, it was a piece of cracked tubing that we fixed during the next site visit.
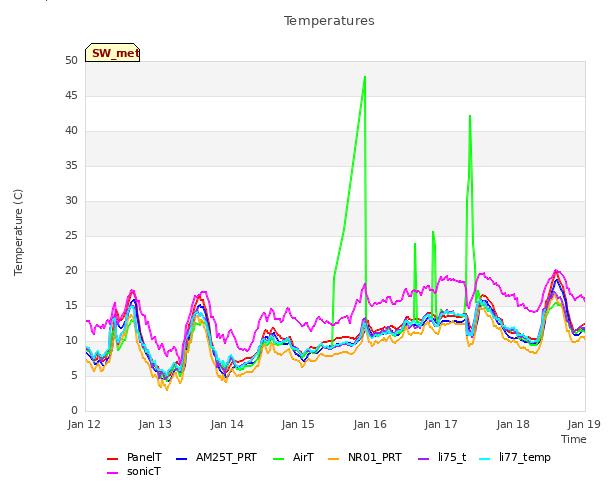
An automatically generated plot of temperature data from various sensors at a site. We would expect these data to line up well, so from this plot we can see immediately that something is funky with the green line, in this case the HMP sensor that provides the “AirT” measurement.
Digital notes – who, where, when, what, why
The whole research process involves copious notes, from recording field observations and equipment swaps, to data processing and analysis notes. Detailed notes help us track field issues that need to be addressed promptly, reducing sensor downtime. A thorough record is also beneficial for personnel and succession planning when site maintenance is inevitably handed over to another staff member.
A thorough record includes documenting who, where, when, and what happened. But also importantly, why. Why did you remove the soil moisture sensor? Did it need to be calibrated? Was the sensor cable chewed by critters? Were you just moving this sensor to another site that needed a soil moisture sensor? This level of detail helps you manage your sites and your sensors, and it will also help future data users interpret the data from that time frame. “Removed soil sensor (sn 11235) and brought back to lab because of chewed cable” and “Removed soil sensor (sn 11235) and installed at XX site to replace broken sensor there” both provide data users with much more information about the data from that particular soil sensor than if you just noted “Removed soil sensor.” Document serial numbers and firmware version, sensors installed or removed at YY depth, changes in wiring or datalogger program (use version control when possible), and changes in measurement location.
Most of us probably take handwritten notes in the field because it is faster, more portable, and somewhat more resistant to field hazards such as water, mud, and unexpected drops. Although it takes time to transfer these handwritten notes to a digital format, digital notes come with many advantages.
Digital search is a powerful tool you can’t access with a stack of notebooks, one that you and future site researchers and technicians can take advantage of. Here are some ways to make the most of your digital notes:
- Host the notes online, e.g., on Box, Google Drive, or Dropbox. Anyone will be able to look it up, even from a field site if you have cellular connectivity. It’s also easy to add to any time you are at a computer, or perhaps even using your phone. You don’t need to dig up any specific notebook.
- Transcribe your handwritten notes soon after the field visit, while the visit is still fresh in your mind.
- Add photos or plots to your notes when possible. This is much easier to do for digital notes over analog notes.
- Use a standard, consistent format for certain, repeated phrases. This will make it easier to search for. For example, if you’re having a problem with your CO2 analyzer with serial number 75H-2176, you can search for “sn 75H-2176” to track the history of this analyzer and find out the last time it was cleaned, calibrated, or otherwise maintained without also needing to search for “serial number,” “serial #,” “serial no.,” “s/n,” etc. Another example would be to use “YYYY-MM-DD” for dates. Using a standard, consistent format makes it easier for machines to read if, down the road, you want to use a pattern-recognition algorithm (e.g., regular expressions) to find certain words or phrases.
Beyond harnessing the power of digital search, digital notes also have other advantages. Taking time to type your notes can also help you organize and flesh out your notes. This will help future staff from needing to decipher your handwritten bullet points with your unique shorthand. Easily accessed and easily searchable digital notes help you and future staff learn from your mistakes and others’ mistakes and experience.
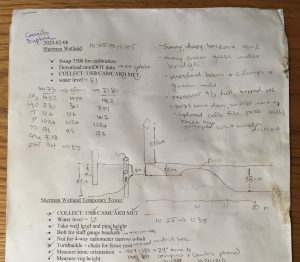
A handwritten field note with muddy edges, unlabeled numbers, and a diagram with water level and instrument heights.
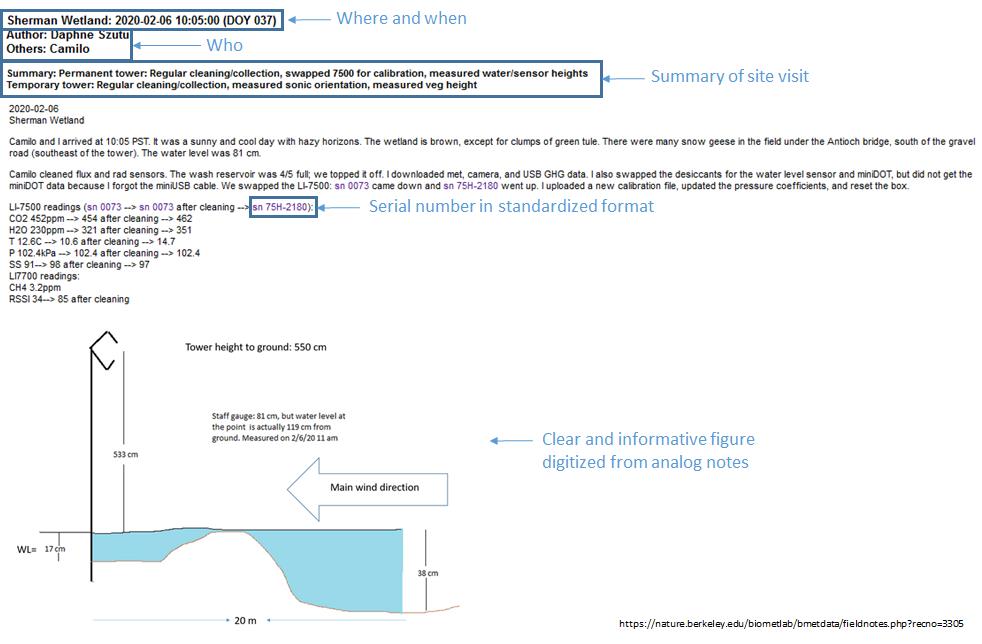
The handwritten field note has been typed up as an online field note. I typed up the handwritten notes the day after the site visit, including information about who, where, when, what, and why. A summary line quickly draws your attention to anything unusual about the visit. All our field notes are hosted online at https://nature.berkeley.edu/biometlab/bmetdata/fieldnotes.php and can be quickly accessed and searched by any one with an internet or cell connection.
Data processing notes – why digital?
In addition to field notes, we also keep our processing notes in an online, digital format. This helps everybody in the group keep track of current processing status across our multiple sites. When a new student or postdoc joins the lab and takes over a particular site, they have quick access to past processing notes and can see past and current concerns. It is also easy to add plots and figures to these processing notes.
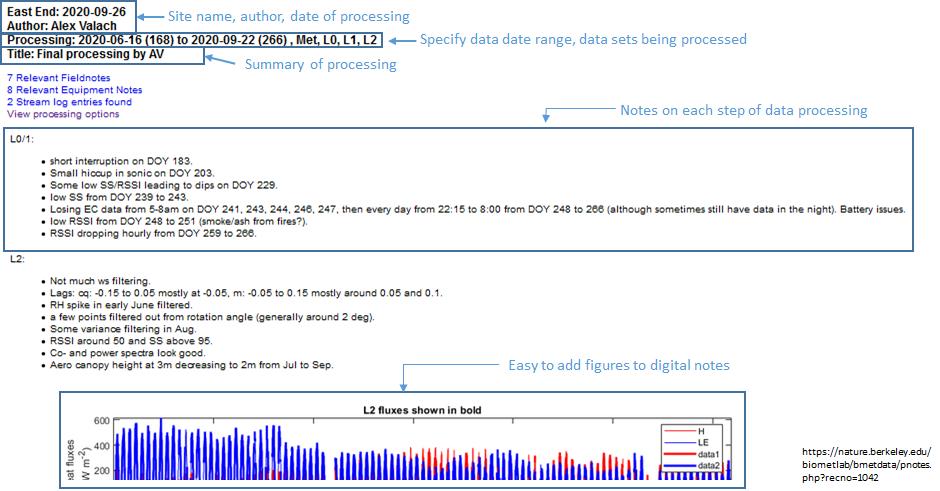
An example of a digitally stored data processing note. The author recorded who processed the data, the date range being processed, notes on each processing step, and relevant plots. Any lab member using the data from this site can easily check any issues or concerns from the most recent flux processing. These processing notes are also hosted on our website, https://nature.berkeley.edu/
We hope these two approaches of automated data visualization and digital field notes and data processing notes can help you collect high-quality data with minimal data gaps. If you have any suggestions or feedback, please post in the comment section below or email me.
No Comments
Be the first to start a conversation