
US-KS3: Kennedy Space Center (salt marsh)
- Overview
- Windroses
- Data Citation
- Data Use Log
- Image Gallery
- Remote Sensing Data
- MODIS
- PhenoCam
- GeoNEX
- Publications
- BADM
| Tower_team: | |
| PI: | Ross Hinkle rhinkle@ucf.edu - University of Central Florida |
| FluxContact: | Rosvel Bracho rbracho@ufl.edu - University of Florida |
| Lat, Long: | 28.7084, -80.7427 |
| Elevation(m): | — |
| Network Affiliations: | AmeriFlux |
| Vegetation IGBP: | WET (Permanent Wetlands: Lands with a permanent mixture of water and herbaceous or woody vegetation that cover extensive areas. The vegetation can be present in either salt, brackish, or fresh water) |
| Climate Koeppen: | Cfa (Humid Subtropical: mild with no dry season, hot summer) |
| Mean Annual Temp (°C): | 22.3 |
| Mean Annual Precip. (mm): | 1340 |
| Flux Species Measured: | CO2, H2O |
| Years Data Collected: | 2017 - 2020 |
| Years Data Available: | AmeriFlux BASE 2018 - 2019 Data Citation AmeriFlux FLUXNET 2018 Data Citation |
| Data Use Policy: | AmeriFlux CC-BY-4.0 Policy1 |
| Description: | Salt marsh dominated by Distichlis and being encroached by Mangrove |
| URL: | — |
| Research Topics: | Carbon flux of coastal salt marsh related to changes related to woody encroachment |
| Acknowledgment: | Thanks to AmeriFlux, DOE, NASA Kennedy Space Center, and US Fish and Wildlife Service. |
- This site’s data can also be used under the more restrictive AmeriFlux Legacy Policy.
The AmeriFlux Legacy Policy must be followed if this site’s data are combined with data from sites that require the AmeriFlux Legacy Policy.
Copyright preference: Request for permission
US-KS3: Kennedy Space Center (salt marsh)
- Overview
- Windroses
- Data Citation
- Data Use Log
- Image Gallery
- Remote Sensing Data
- MODIS
- PhenoCam
- GeoNEX
- Publications
- BADM
Use the information below for citation of this site. See the Data Policy page for more details.
DOI(s) for citing US-KS3 data
Data Use Policy: AmeriFlux CC-BY-4.0 License
This site’s data can also be used under the more restrictive AmeriFlux Legacy Policy.
The AmeriFlux Legacy Policy must be followed if US-KS3 data are combined with data from sites that require the AmeriFlux Legacy Policy.
- AmeriFlux BASE: https://doi.org/10.17190/AMF/1562390
Citation: Rosvel Bracho, Charles Ross Hinkle (2019), AmeriFlux BASE US-KS3 Kennedy Space Center (salt marsh), Ver. 1-5, AmeriFlux AMP, (Dataset). https://doi.org/10.17190/AMF/1562390 - AmeriFlux FLUXNET: https://doi.org/10.17190/AMF/1881586
Citation: Rosvel Bracho, Charles Ross Hinkle (2026), AmeriFlux FLUXNET-1F US-KS3 Kennedy Space Center (salt marsh), Ver. v1.3_r1, AmeriFlux AMP, (Dataset). https://doi.org/10.17190/AMF/1881586
Find global FLUXNET datasets, like FLUXNET2015 and FLUXNET-CH4, and their citation information at fluxnet.org.
To cite BADM when downloaded on their own, use the publications below for citing site characterization. When using BADM that are downloaded with AmeriFlux BASE and AmeriFlux FLUXNET products, use the DOI citation for the associated data product.
Publication(s) for citing site characterization
- —
Acknowledgments
- —
Resources
- AmeriFlux Logos & Acknowledgments
US-KS3: Kennedy Space Center (salt marsh)
- Overview
- Windroses
- Data Citation
- Data Use Log
- Image Gallery
- Remote Sensing Data
- MODIS
- PhenoCam
- GeoNEX
- Publications
- BADM

This page displays the list of downloads of data for the site {{siteId}}.
Note: Results are the number of downloads to distinct data users. The Download Count column indicates the number of times the data user downloaded the data. The Version column refers to the version of the data product for the site that was downloaded by the data user.
| Date | Name | Data Product | Vers. | Intended Use | Intended Use Description | Download Count |
|---|---|---|---|---|---|---|
| {{dlObject.timeStamp}} | {{dlObject.displayName}} | {{displayProduct(dlObject.dataProduct)}} | {{dlObject.version}} | {{dlObject.intendedUse}} | {{dlObject.comment}} | {{dlObject.downloadCounter}} |
Showing {{startItem + 1}} to {{(startItem + items) > filtered.length ? filtered.length : (startItem + items)}} of {{filtered.length}} results
Showing 0 to 0 of 0 results
Not Found
Uh Oh. Something is missing. Try double checking the URL and try again.
US-KS3: Kennedy Space Center (salt marsh)
- Overview
- Windroses
- Data Citation
- Data Use Log
- Image Gallery
- Remote Sensing Data
- MODIS
- PhenoCam
- GeoNEX
- Publications
- BADM
| AmeriFlux Images | Add Image |
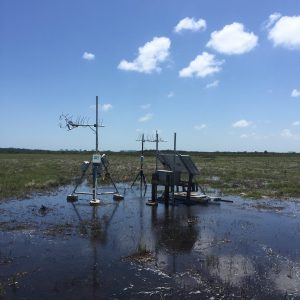
US-KS3 IMG_4807
IMG_4807)
Keywords: —
Location:
View in Original Size
To download, right-click photo (Mac: control-click) and choose Save Image As
 US-KS3
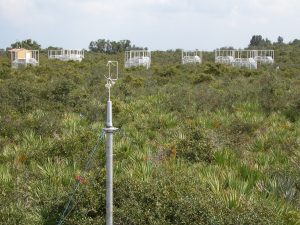
 Anemometer and Chambers
Keywords: —
Location: United States
View in Original Size
To download, right-click photo (Mac: control-click) and choose Save Image As
US-KS3: Kennedy Space Center (salt marsh)
- Overview
- Windroses
- Data Citation
- Data Use Log
- Image Gallery
- Remote Sensing Data
- MODIS
- PhenoCam
- GeoNEX
- Publications
- BADM
| AmeriFlux Publications | Add Publication |
US-KS3: Kennedy Space Center (salt marsh)
- Overview
- Windroses
- Data Citation
- Data Use Log
- Image Gallery
- Remote Sensing Data
- MODIS
- PhenoCam
- GeoNEX
- Publications
- BADM
BADM for This Site
Access the Biological, Ancillary, Disturbance and Metadata (BADM) information and data for this site.
BADM contain information for many uses, such as characterizing a site’s vegetation and soil, describing disturbance history, and defining instrumentation for flux processing. They complement the flux/met data.
- Download BADM for this site*
- View Site General Info for this site (Overview tab)*
- Use Online Editor to update Site General Info or DOI Authorship
- Update information about submitted data (Variable Information tool)
- More BADM resources
* Online updates are shown on the Overview tab real time. However, downloaded BADM files will not reflect those updates until they have been reviewed for QA/QC.
US-KS3: Kennedy Space Center (salt marsh)
- Overview
- Windroses
- Data Citation
- Data Use Log
- Image Gallery
- Remote Sensing Data
- MODIS
- PhenoCam
- GeoNEX
- Publications
- BADM
Wind Roses
Wind Speed (m/s)
- Wind Speed Scale: Per Site
- Wind Direction Scale (%): Per Site
- Wind Speed Scale: Non-Linear
- Wind Direction Scale (%): AmeriFlux