
Feature photo: Jeff Miller, University of Wisconsin-Madison Communications
The English word “scale” has a surprisingly broad range of definitions. Whether you think of the scales of a fish, the scale on which you weigh yourself, the music scale you play on an instrument, the tower you scale to fix your sonic, or the ring of deposited mineral scale left behind in your tea kettle, it sure is a versatile word.
Similarly, scale represents a multitude of concepts in science. A recent paper by Yong Ge and co-authors (2019) summarizes the perspective for Earth system science. Ge et al identify several different types of scale such as the intrinsic scales of the process and the pattern it generates, the measurement scales associated with extent, sampling, and averaging schemes that make up observations of those patterns and process, and the spatial and temporal resolutions that establish its representation in models and further aggregation done for visualization and decision support.
These questions of scale resonate broadly in flux tower science too, especially in questions of upscaling, synthesis, and model-data comparison (Metzger, 2018). No observation we make with our towers or ancillary observations, nor any models we run of the processes those observations sample are done without some specification of the scales defined above. In some cases, the scale may be implicit, as in the case of running a “point-scale” ecosystem model or the assumption of homogeneity in a flux tower footprint. Not considering these assumptions is an explicit choice.
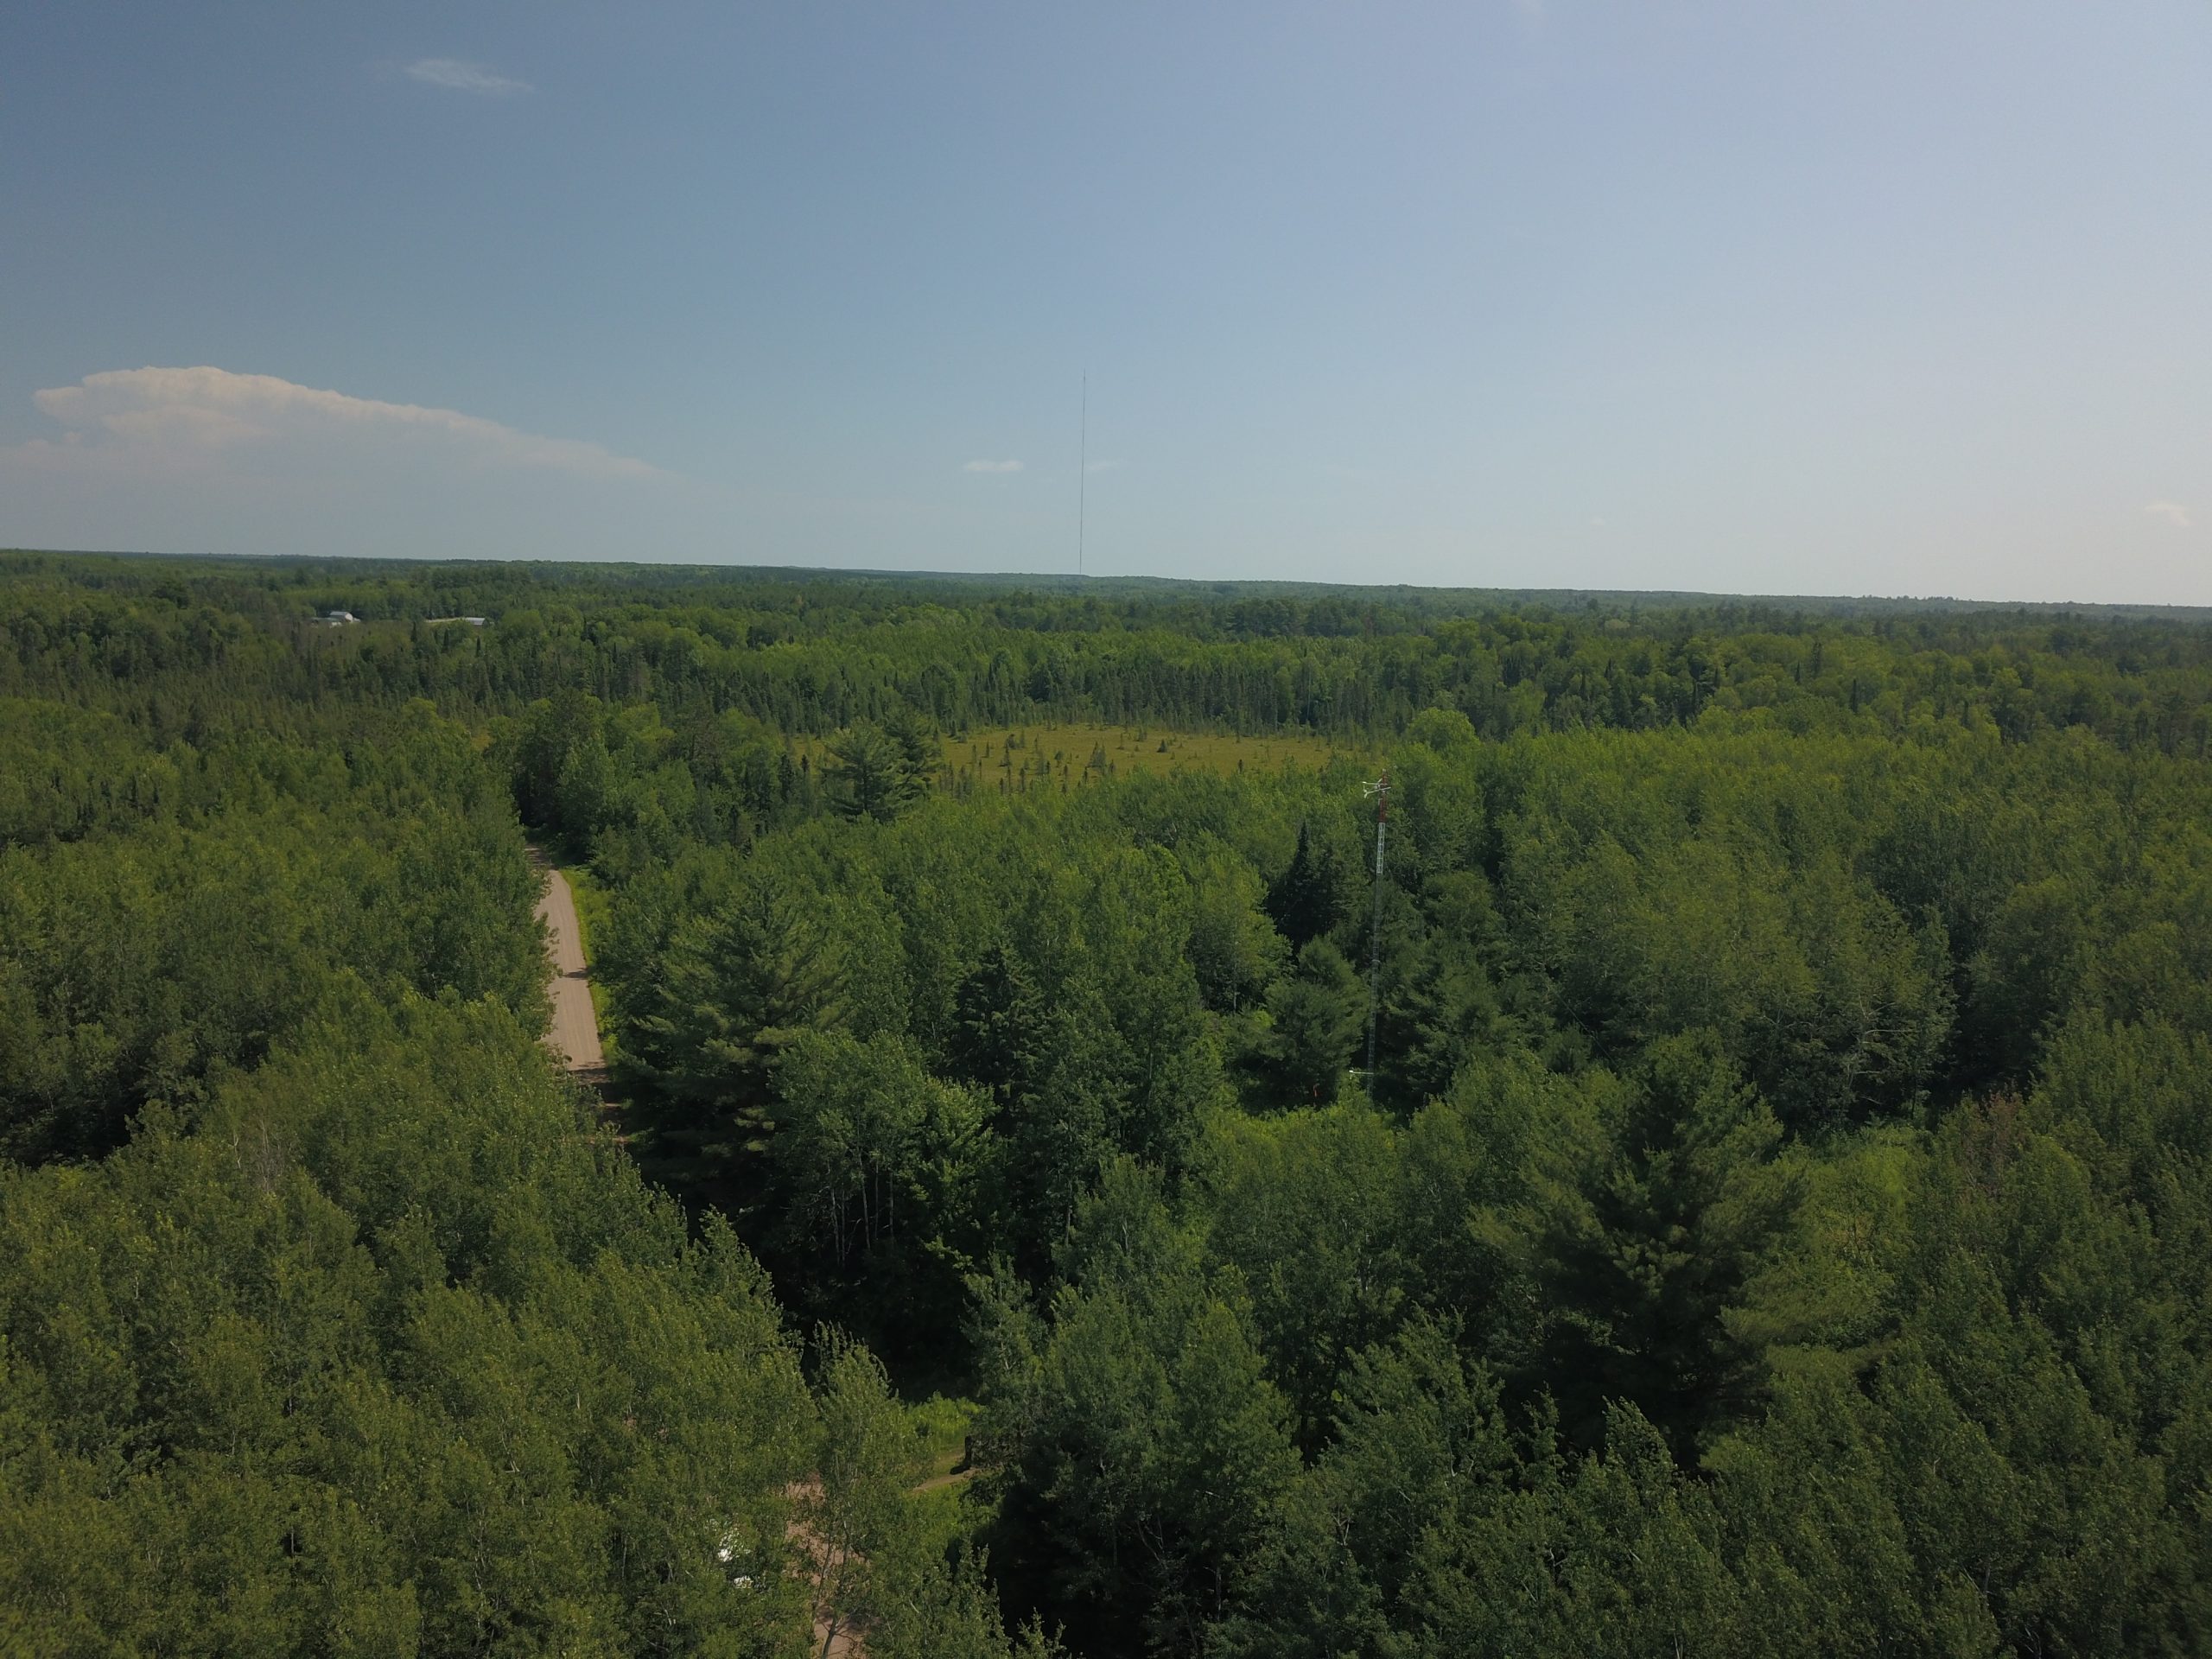
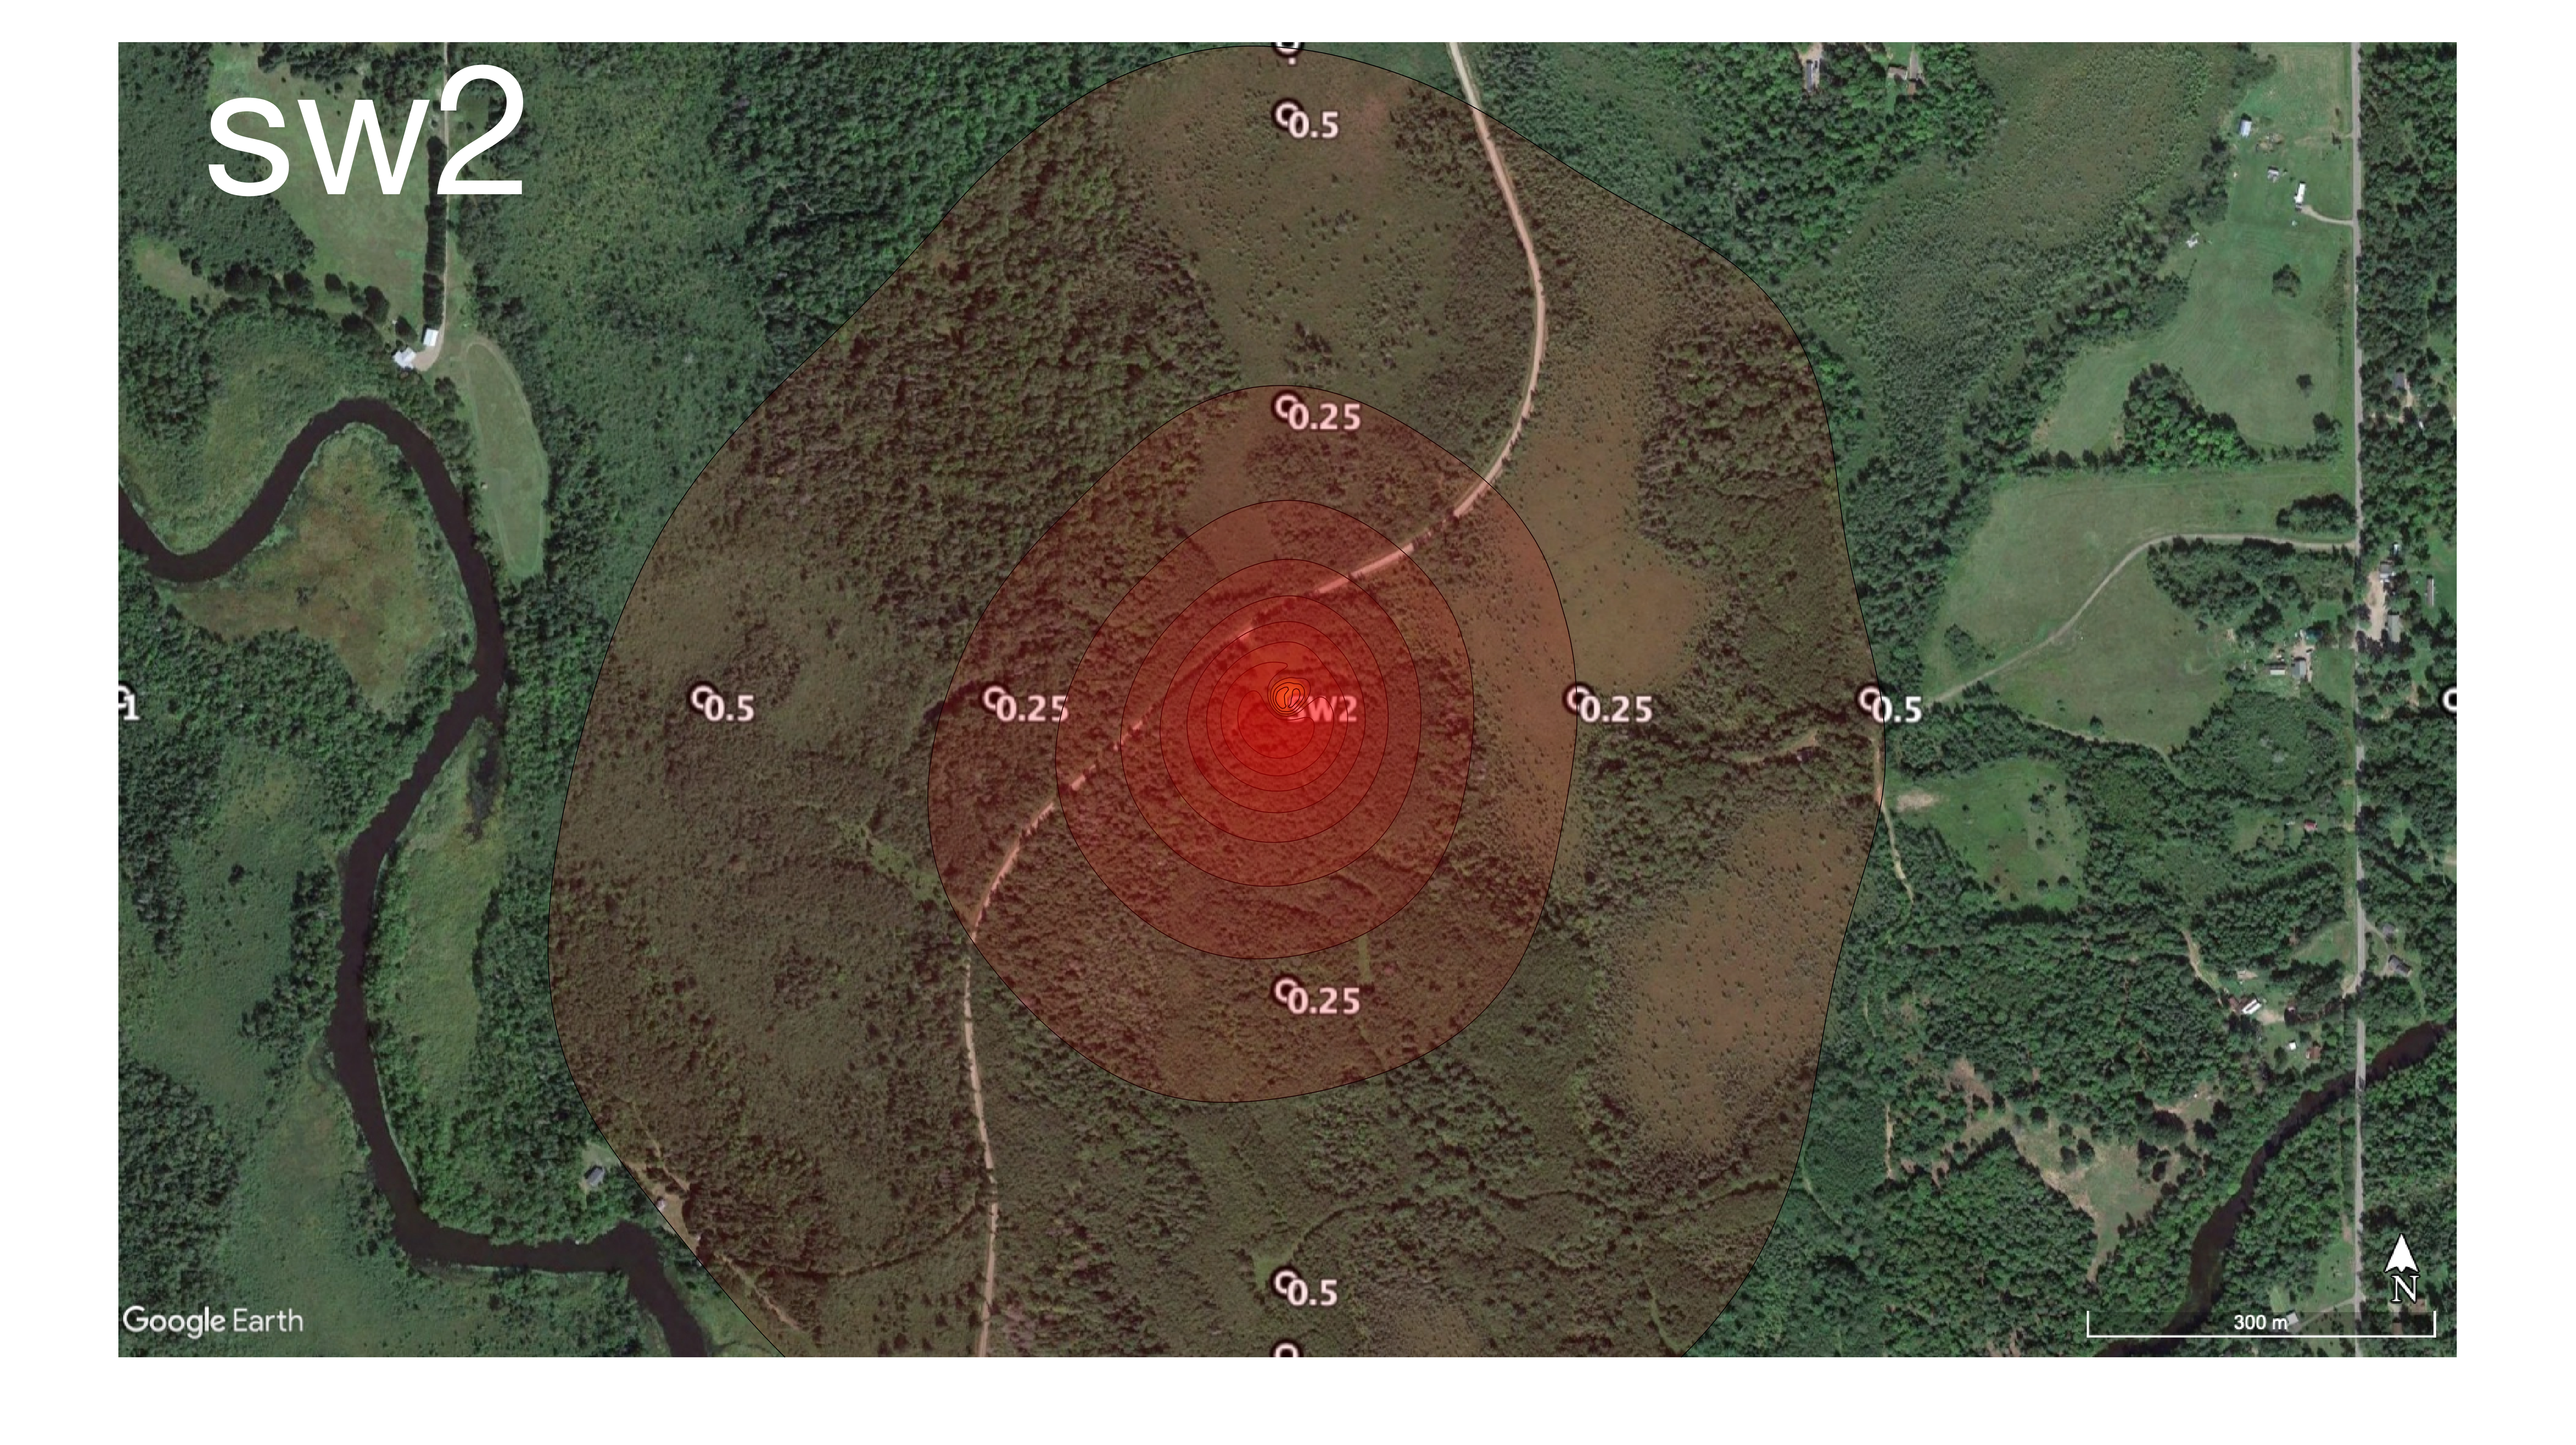
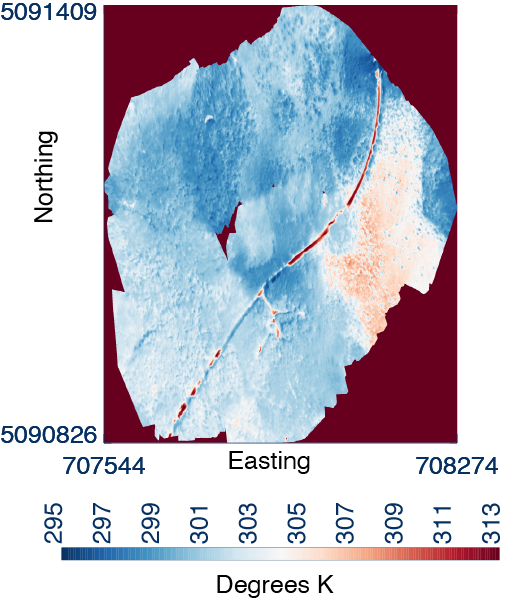
(top) A drone photo shows a typical flux tower deployment of the “SW2” CHEESEHEAD19 flux tower with the US-PFa tall tower in the background (photo credit: Peter Janssen), though (middle) a footprint climatology reveals several inhomogeneities in the landscape (image credit: Brian Butterworth / Google Earth) and (bottom) promotes large 18-degree land surface temperature gradients seen in a NOAA ATDD drone flown mid-day on July 12, 2019 (from Desai et al., 2021b)
In many cases, this lack of consideration might be a reasonable approximation. But the real-world in which we operate our flux towers beguiles us. Consider the drone photo below of a flux tower deployed by the National Center for Atmospheric Research (NCAR) during the Chequamegon Heterogenous Ecosystem Energy-balance Study Enabled by a High-density Extensive Array of Detectors 2019 (CHEESEHEAD19) field experiment that I ran (Butterworth et al., 2021). For this experiment, 19 eddy covariance towers (US-PFb through US-PFt) were quasi-randomly placed in a 10×10 km domain in northern Wisconsin USA to test theories of scaling and in particular, the impact that scaling has on energy balance closure (Mauder et al., 2020). From the photo, it may seem like a reasonable location, but a footprint map quickly reveals some inhomogeneities and a drone sample of 1-meter resolution land surface temperature during the experiment (Desai et al., 2021b) reveals the multi-scale nature of hot spots and cold spots within that. What are the tower half-hourly fluxes representative of? What land cover would one use in a model for this site? Even if the open clearing were not in the footprint, would it still influence the flux? Would changing the averaging time to hourly have an impact? While this may be a more extreme example, these types of variations are ever present in every half-hour in the entire AmeriFlux database.
The good news is that many of these scale issues can be resolved through explicit consideration of them. In CHEESEHEAD19, in addition to our 19 flux towers, we have the long-running (since 1996!) US-PFa Ameriflux core site tower that measures fluxes at 30, 120, and 400 m above ground, with flux footprints that extend out kilometers (Desai, 2021)! PhD student Bailey Murphy is currently evaluating how various upscaling covariates of forest type and canopy structure as influenced by management and disturbance history can be used to optimally scale the 19 towers to represent the tall tower regional carbon flux. Meanwhile, PhD student Sreenath Paleri, researcher Brian Butterworth, and NEON scientist Stefan Metzger are extending work by Metzger and former PhD student Ke Xu on applying a machine learning algorithm, the Environmental Response Function Virtual Control Volume (ERF-VCV), to “rectify” fluxes based on high-frequency application of flux footprints so that the flux and profile observations are scale-resolved (Metzger et al., 2013; Xu et al., 2018). What we are learning from these exercises is that the explicit correction for spatial measurement scale, by virtue of incorporating larger spatially coherent eddies, also reduces energy imbalance, thereby increasing reliability of model evaluation with flux measurements.
Our long-term goal is to extend these approaches to be straightforward to apply to any flux tower observation made. By making scale explicit in all its forms, we are more likely to generate reliable flux estimates that have value for model evaluation and robust upscaling. Several of these advances are being documented in an open special collection in AGU journals on Advances in Scaling of Land-Atmosphere Interaction (Desai et al., 2021a). The collection is open through the end of May 2022. If you have some good ideas or examples of where scale considerations can come to our rescue, I encourage you to submit to it!
Ankur R. Desai is Professor and Chair, Dept of Atmospheric and Oceanic Sciences, at the University of Wisconsin-Madison and @profdesai on Twitter.
Ameriflux core site PI for US-PFa, US-Syv, US-WCr, US-Los, US-ALQ
Other Ameriflux sites: US-Pnp, US-Men, US-CS1, US-CS2, US-CS3, US-CS4, US-CS5, US-PFb to US-PFt, US-DFC, US-DFK
References
Butterworth, B. J., Desai, A. R., Metzger, S., Townsend, P. A., Schwartz, M. D., Petty, G. W., Mauder, M., Vogelmann, H., Andresen, C. G., Augustine, T. J., Bertram, T. H., Brown, W. O. J., Buban, M., Cleary, P., Durden, D. J., Florian, C. R., Iglinski, T. J., Kruger, E. L., Lantz, K., Lee, T. R., Meyers, T. P., Mineau, J. K., Olson, E. R., Oncley, S. P., Paleri, S., Pertzborn, R. A., Pettersen, C., Plummer, D. M., Riihimaki, L. D., Guzman, E. R., Sedlar, J., Smith, E. N., Speidel, J., Stoy, P. C., Sühring, M., Thom, J. E., Turner, D. D., Vermeuel, M. P., Wagner, T. J., Wang, Z., Wanner, L., White, L. D., Wilczak, J. M., Wright, D. B., & Zheng, T: Connecting Land–Atmosphere Interactions to Surface Heterogeneity in CHEESEHEAD19, Bulletin of the American Meteorological Society, 102(2), E421-E445., 2021.
Desai, A.R. AmeriFlux BASE US-PFa Park Falls/WLEF, Ver. 19-5, AmeriFlux AMP, (Dataset). doi:10.17190/AMF/1246090, 2021.
Desai, A. R., Butterworth, B., Metzger, S., Mauder, M.: Advances in scaling and modeling of land-atmosphere interactions, Eos, 102, doi:10.1029/2021EO155255, 2021a.
Desai, A.R., Khan, A.M., Zheng, T., Paleri, S., Butterworth, B., Lee, T.R., Fisher, J.B., Hulley, G., Kleynhans, T., Gerace, A., Townsend, P.A., Stoy, P., Metzger, S.: Multi‐Sensor Approach for High Space and Time Resolution Land Surface Temperature. Earth Space Sci 8. https://doi.org/10.1029/2021EA001842, 2021b.
Ge, Y., Jin, Y., Stein, A., Chen, Y., Wang, J., Wang, J., Cheng, Q., Bai, H., Liu, M., Atkinson, P.M.: Principles and methods of scaling geospatial Earth science data. Earth-Science Reviews, 197, 102897, doi:10.1016/j.earscirev.2019.102897., 2019.
Mauder, M., Foken, T., Cuxart, J.: Surface-Energy-Balance Closure over Land: A Review. Boundary-Layer Meteorol. https://doi.org/10.1007/s10546-020-00529-6, 2020.
Metzger, S., Junkermann, W., Mauder, M., Butterbach-Bahl, K., Trancón y Widemann, B., Neidl, F., Schäfer, K., Wieneke, S., Zheng, X. H., Schmid, H. P., and Foken, T.: Spatially explicit regionalization of airborne flux measurements using environmental response functions, Biogeosciences, 10, 2193-2217, doi:10.5194/bg-10-2193-2013, 2013.
Metzger, S.: Surface-atmosphere exchange in a box: Making the control volume a suitable representation for in-situ observations. Agric. For. Meteor.,255, 68–80, https://doi.org/10.1016/j.agrformet.2017.08.037, 2018.
Xu, K., Metzger, S., Desai, A.R.: Surface-atmosphere exchange in a box: Space-time resolved storage and net vertical fluxes from tower-based eddy covariance. Agricultural and Forest Meteorology, 255, 81-91, doi:10.1016/j.agrformet.2017.10.011, 2018.
No Comments
Be the first to start a conversation