
Over the past decades, the eddy covariance (EC) community has clearly demonstrated the power of networks; regional networks and FLUXNET have shown us that combining data across multiple sites creates a whole that is greater than the sum of its parts. The FLUXNET database has been used extensively to evaluate satellite measurements, inform Earth system models, generate data-driven CO2 products, and provide answers to a broad range of questions about atmospheric fluxes related to ecosystems, land use and climate. FLUXNET has grown steadily over the past years, enhancing our understanding of carbon, water and energy cycles in terrestrial ecosystems. To date, similar community efforts and syntheses for CH4 remain limited in part because EC measurements for CH4 fluxes were rarer until recently. However, with new advances in sensor development, the past decade has seen a rapidly growing number of EC CH4 flux measurements which present new opportunities for FLUXNET-type analyses and syntheses of ecosystem-scale CH4 flux observations.
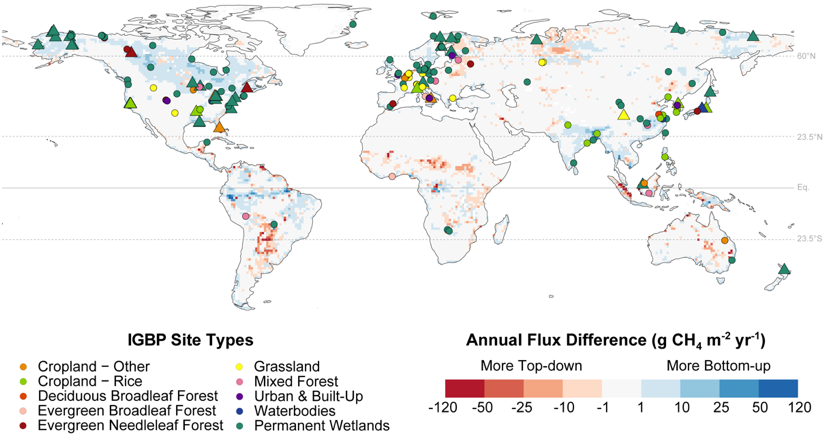
Figure 1. Location of the 200 tower sites that report eddy covariance CH4 flux measurements worldwide. Triangles indicate sites from which data are included in this manuscript, with circles indicating additional flux towers measuring CH4 fluxes. The colors of the markers represent the vegetation type based on the International Geosphere-Biosphere Programme (IGBP) definition. See Table S1 from Knox et al., 2019 for a list of sites, their characteristics, and years of operation. Sites are overlaid over a map of the differences between the average CH4 emissions over 2000-2010 between top-down and bottom-up wetland CH4 estimates. Top-down estimates are represented by the natural fluxes inventoried in NOAA’s CarbonTracker. Bottom-up emissions were produced from an ensemble of 11 Earth System Models simulations (Poulter et al. 2017) (© Copyright 17 July 2019 AMS).
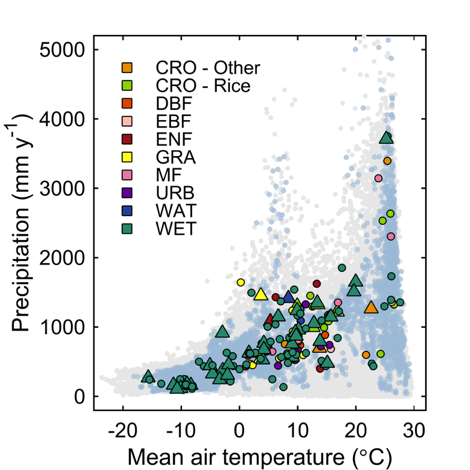
Figure 2. Distribution of sites by mean annual air temperature and precipitation. Tower locations are shown as circles or triangles, with vegetation type in color based on the IGBP definitions. Gray dots represent annual mean temperature and total precipitation from the CRU TS 3.10 gridded climate dataset over the entire land mass (Harris et al. 2014), whereas blue dots represent grid cells with >25% wetland fraction as estimated using the Global Lakes and Wetlands Database (Lehner and Döll 2004). (© Copyright 17 July 2019 AMS).
FLUXNET-CH4 is an initiative led by the Global Carbon Project, in close partnership with AmeriFlux and EuroFlux, to compile a global database of existing EC CH4 flux measurements (Knox et al., 2019). The goal of the activity is to develop a global database for EC CH4 observations to answer regional and global questions related to CH4 cycling. The initiative is open to all members of the EC community. Database compilation began in 2017 and is ongoing. Currently we have compiled data from 60 sites of the 200 sites worldwide we estimate are recording EC CH4 flux measurements. We are working to expand the database through 2020 and welcome new contributions (see below for contact information).
While the EC CH4 flux tower sites we identified cover a broad range of climates and a large fraction of unmanaged and managed wetland habitats (Figure 2), the tropics and tropical wetlands are notably underrepresented. One important goal of FLUXNET and the networks is to promote site representativeness and extend measurements in under-sampled regions. Increasing the number of tropical sites is particularly important for CH4 as more than half of global wetland CH4 emissions are thought to come from this region.
Using this integrated CH4 flux database, we are investigating how fluxes differ across sites and which factors are associated with varying CH4 emissions across wetlands (Knox et al., 2019). Annual estimates of net CH4 flux for each of the 60 sites in the flux tower database range from -0.2 ± 0.02 g C m-2 y-1 for an upland forest site to 114.9 ± 13.4 g C m-2 y-1 for an estuarine freshwater marsh, with fluxes exceeding 40 g C m-2 y-1 at multiple sites (Figure 3b). These emissions are of a considerably broader range and have much higher annual values than in an earlier synthesis by Baldocchi (2014) which included published values from 13 sites (Figure 3a).
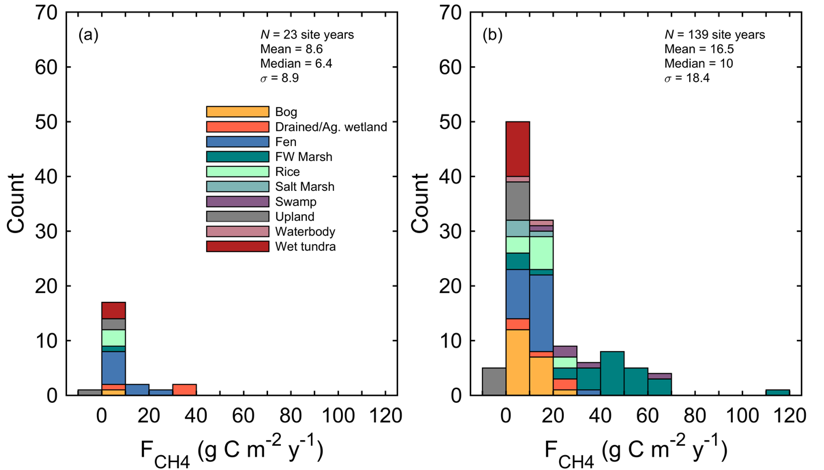
Figure 3. (a) Histogram of annual CH4 fluxes (FCH4; g C m-2 y-1) measured with eddy covariance and published in the synthesis by Baldocchi (2014), and (b) histogram of annual CH4 fluxes including additional site years of data estimated from the 60 sites (© Copyright 17 July 2019 AMS).
At global scales, mean annual air and soil temperature are the most important predictors of annual CH4 flux across wetland sites (Figure 4a, b). This differs from previous chamber-based syntheses that found a much weaker relationship between soil temperature and average CH4 emissions across sites. Water- table position is positively correlated with annual CH4 emissions, although only for wetland sites that were not consistently inundated throughout the year (Figure 4c). However, only half of the sites currently included in the database report water table position, and given the importance of water levels in regulating CH4 exchange, it is critical to ensure that water table depth is reported across all sites. We also observed a significant increase in the ratio of annual CH4 to ecosystem respiration along geographic gradients, suggesting that warming may result in a greater relative contribution of CH4 to total carbon emissions from wetland ecosystems (Figure 4d).
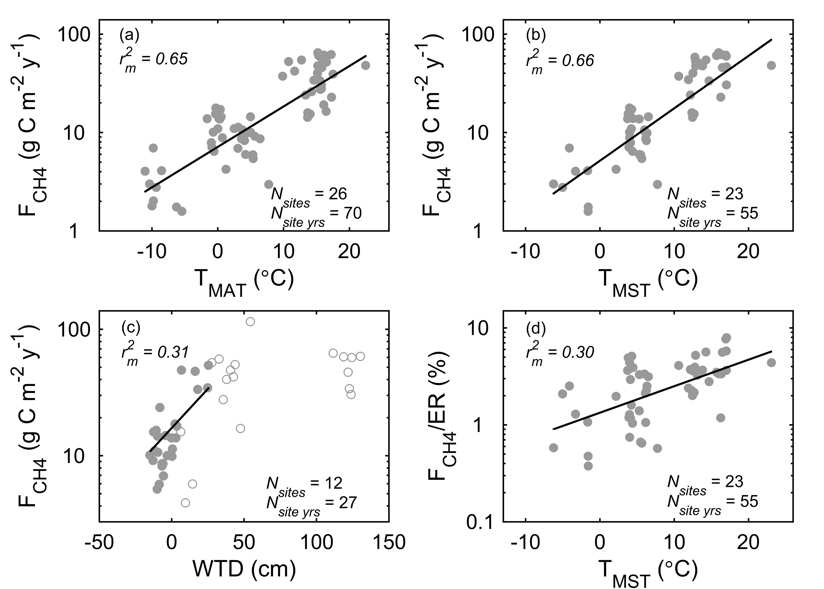
Figure 4. Relationship between annual CH4 flux (FCH4) and (a) mean annual air temperature (TMAT) (χ2 = 36.7, df = 1, p < 0.001), (b) mean annual soil temperature (TMST) (χ2 = 32.3, df = 1, p < 0.001) for freshwater wetlands, and (c) mean water table depth (WTD). While there was no significant relationship between mean annual WTD and annual CH4 flux across all sites, there was a significant relationship if we consider only sites where WTD was below the soil surface for part or all of the year (solid circles) (χ2 = 5.6, df = 1, p < 0.05). Open circles in (c) indicate CH4 emissions for permanently inundated sites. (d) shows the temperature dependence of the annual CH4:Ecosystem respiration (ER) ratio (χ2 = 12.0, df = 1, p < 0.001). Lines represent the fitted values for the population (© Copyright 17 July 2019 AMS).
With a growing FLUXNET CH4 database, it will be possible to further explore the dominant controls on CH4 fluxes within and across ecosystem types. This is something we are continuing to investigate through a USGS Powell Center Working Group which is focused on improving understanding and prediction of CH4 fluxes at daily to interannual timescales. Through this Powell activity, we are also utilizing the global CH4 database to parameterize and benchmark the performance of land-surface models of global methane emissions, as this dataset provides a unique opportunity for informing and validating biogeochemical models.
Another goal of the FLUXNET-CH4 activity is to generate a publicly available, open-access, data-driven global CH4 emissions product using similar machine-learning-based approaches used by FluxCom for CO2, water and energy fluxes. This gridded product is being developed in partnership with the Stanford Machine Learning Group and AI for Climate Change Bootcamp. This gridded product will provide an independent bottom-up estimate of global wetland CH4 emissions to compare with estimates of global CH4 emissions from land-surface models and atmospheric inversions. Recent work has shown the potential to upscale EC CH4 flux observations across northern wetlands (Peltola et al., 2019), however, our objective is to expand this to a globally gridded product.
Through coordinating, organizing and improving the integration of CH4 fluxes in regional networks and ultimately FLUXNET, we hope to bring us one step closer to achieving the goal of providing flux information “everywhere and all of the time”. In the long-term, we hope to integrate the global EC CH4 database with other methods for measuring CH4 fluxes, such as chamber, aircraft, and satellite measurements. By integrating CH4 flux measurements, remote sensing, and modeling, the goal is to better characterize CH4 emissions from terrestrial ecosystems and ultimately reduce uncertainties in the global CH4 cycle.
This post was authored by Dr. Sara Knox (University of British Columbia) as a contribution to the AmeriFlux Year of Methane.
Baldocchi D. (2014) Measuring fluxes of trace gases and energy between ecosystems and the atmosphere–the state and future of the eddy covariance method. Global Change Biology, 20, 3600-3609, https://doi-org.stanford.idm.oclc.org/10.1111/gcb.12649
Knox S. H. Jackson R. B. Poulter B. McNicol G. Fluet-Chouinard E. Zhang Z. Hugelius G. Bousquet, P. Canadell J. G. Papale D. et al (2019) FLUXNET-CH4 synthesis activity: Objectives, observations, and future directions. Bulletin of the American Meteorological Society, https://doi.org/10.1175/BAMS-D-18-0268.1
Peltola O. Vesala T. Gao Y. Räty O. Alekseychik P. Aurela M. Chojnicki B. Desai A. R. Dolman A. J. Euskirchen E. et al. Monthly Gridded Data Product of Northern Wetland Methane Emissions Based on Upscaling Eddy Covariance Observations. Earth Syst. Sci. Data Discuss., https://doi.org/10.5194/essd-2019-28, in review, 2019.
Acknowledgements
FLUXNET-CH4 Contributors
Sara H. Knox, Robert B. Jackson, Benjamin Poulter, Gavin McNicol, Etienne Fluet-Chouinard, Zhen Zhang, Gustaf Hugelius, Philippe Bousquet, Josep G. Canadell, Marielle Saunois, Dario Papale, Housen Chu, Trevor F. Keenan, Dennis Baldocchi, Margaret S.Torn, Ivan Mammarella, Carlo Trotta
Current Site PIs – 60 Sites; 66 Contributors; 54 Institutions
Mika Aurela, Gil Bohrer, David I. Campbell, Alessandro Cescatti, Samuel Chamberlain, Jiquan Chen, Weinan Chen, Sigrid Dengel, Ankur R. Desai, Eugenie Euskirchen, Thomas Friborg, Daniele Gasbarra, Ignacio Goded, Mathias Goeckede, Martin Heimann, Manuel Helbig, Takashi Hirano, David Y. Hollinger, Hiroki Iwata, Minseok Kang, Janina Klatt, Ken W. Krauss, Lars Kutzbach, Annalea Lohila, Bhaskar Mitra, Timothy H. Morin, Mats B. Nilsson, Shuli Niu, Asko Noormets, Walter C. Oechel, Matthias Peichl, Olli Peltola, Michele L. Reba, Andrew D. Richardson, Benjamin R. K. Runkle, Youngryel Ryu, Torsten Sachs, Karina V. R. Schäfer, Hans Peter Schmid, Narasinha Shurpali, Oliver Sonnentag, Angela C. I. Tang, Masahito Ueyama, Rodrigo Vargas, Timo Vesala, Eric J. Ward, Lisamarie Windham-Myers, Georg Wohlfahrt, Donatella Zona
This work is supported by the Gordon and Betty Moore Foundation, the USGS Powell Synthesis Center, AmeriFlux, the European Fluxes Database Cluster, and FLUXNET.
Contact information: Please contact Dr. Sara Knox (sara.knox@ubc.ca), Dr. Robert Jackson (rob.jackson@stanford.edu), and Dr. Gavin McNicol (gmcnicol@stanford.edu) if you wish to contribute to this activity. Data from sites in the Americas can be submitted to AmeriFlux; otherwise, data can be submitted to the European Fluxes Database Cluster.

No Comments
Be the first to start a conversation