
Guest blog!
The Application for Extracting and Exploring Analysis Ready Samples (AppEEARS) is an online web application that lets users access and visualize geospatial data from various federal data archives, simply and efficiently.
Let’s highlight an example of a simple AppEEARS point sample request for 25 Ameriflux sites located across Canada. We select sites listed as Evergreen Needleleaf Forests (ENF), as classified by the International Geosphere-Biosphere Programme (IGBP) land cover classification schema. Each site is also categorized based on its Köppen climate classification. Using AppEEARS, we easily extract time series data from 2002 to 2018 for three environmental variables derived from NASA’s Moderate Resolution Imaging Spectroradiometer (MODIS) sensor, so we can efficiently explore the environmental temporal dynamics of the sites. The MODIS sensor is located on two different NASA Earth Observing System (EOS) satellites: Terra and Aqua. Between the two satellites, nearly two decades of global, environmental data are available to the public at no charge. The environmental variables of interest for this example are 8-day composite Leaf Area Index (LAI) (MCD15A2H.006), 8-day composite Gross Primary Productivity (GPP) (MOD17A2H.006), and 8-day composite Evapotranspiration (ET) (MOD16A2.006).
This point sample request (Figure 1) accesses and extracts a single pixel of data from 4,452 data granules stored at NASA’s Land Processes Distributed Active Archive Center (LP DAAC). The amount of time and energy saved using AppEEARS to execute this task is immense relative to downloading and processing the data file by file. Data values are returned to us in a series of downloadable *.csv files, which can be further investigated in a statistical package such as R or Excel. On top of that, the AppEEARS user interface offers us a way to explore the data values through a series of visualizations.

Figure 1: Completed AppEEARS point sample form. The 25 locations are denoted by the groupings in the yellow and green circles and the blue marker.
The data visualizations in AppEEARS can be used to explore data values, quality information, and trends. In this point sample request we can quickly determine the magnitude and trend of MODIS LAI, ET, or GPP from the output visualization at a site (Figure 2a and b).
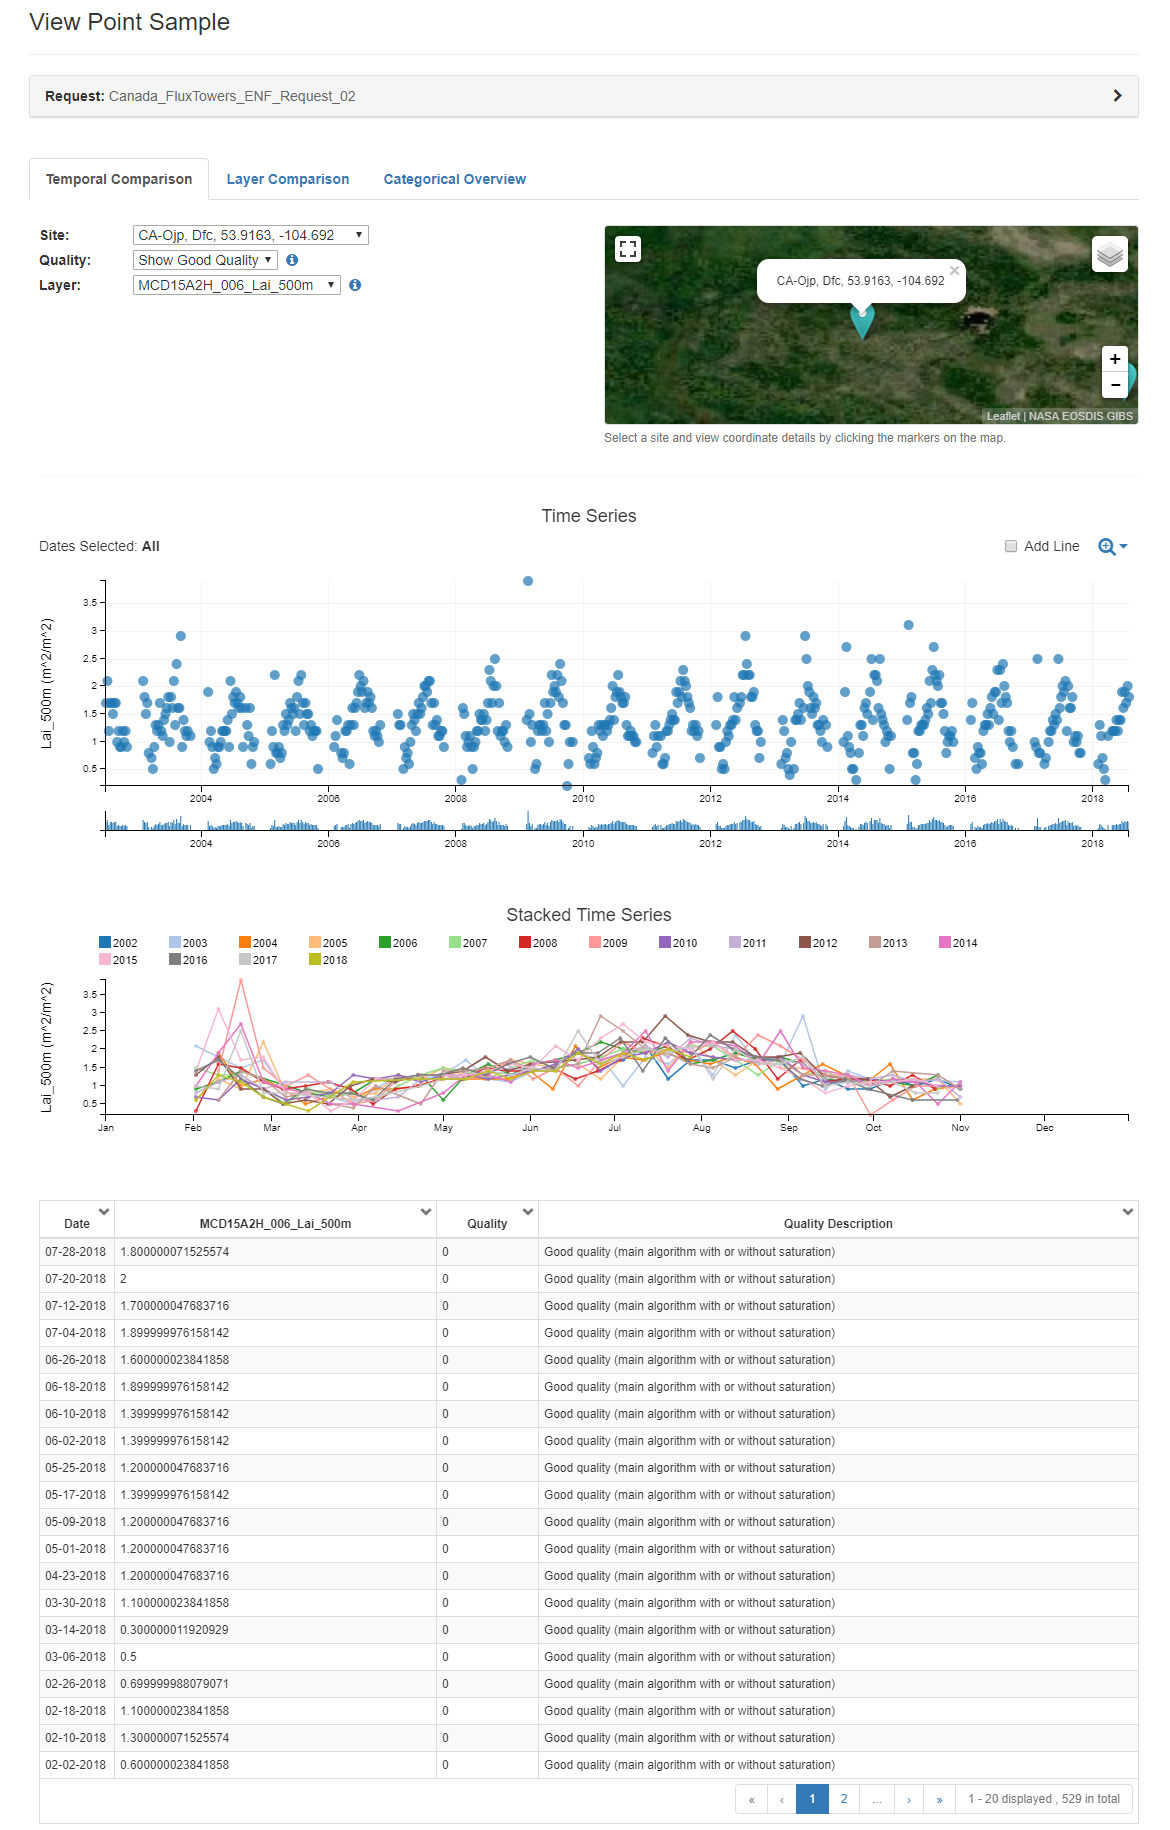
Figure 2a: AppEEARS exploratory data visualizations – LAI (MCD15A2H.006) from 2002 to 2018 at Ameriflux Site CA-Ojp.
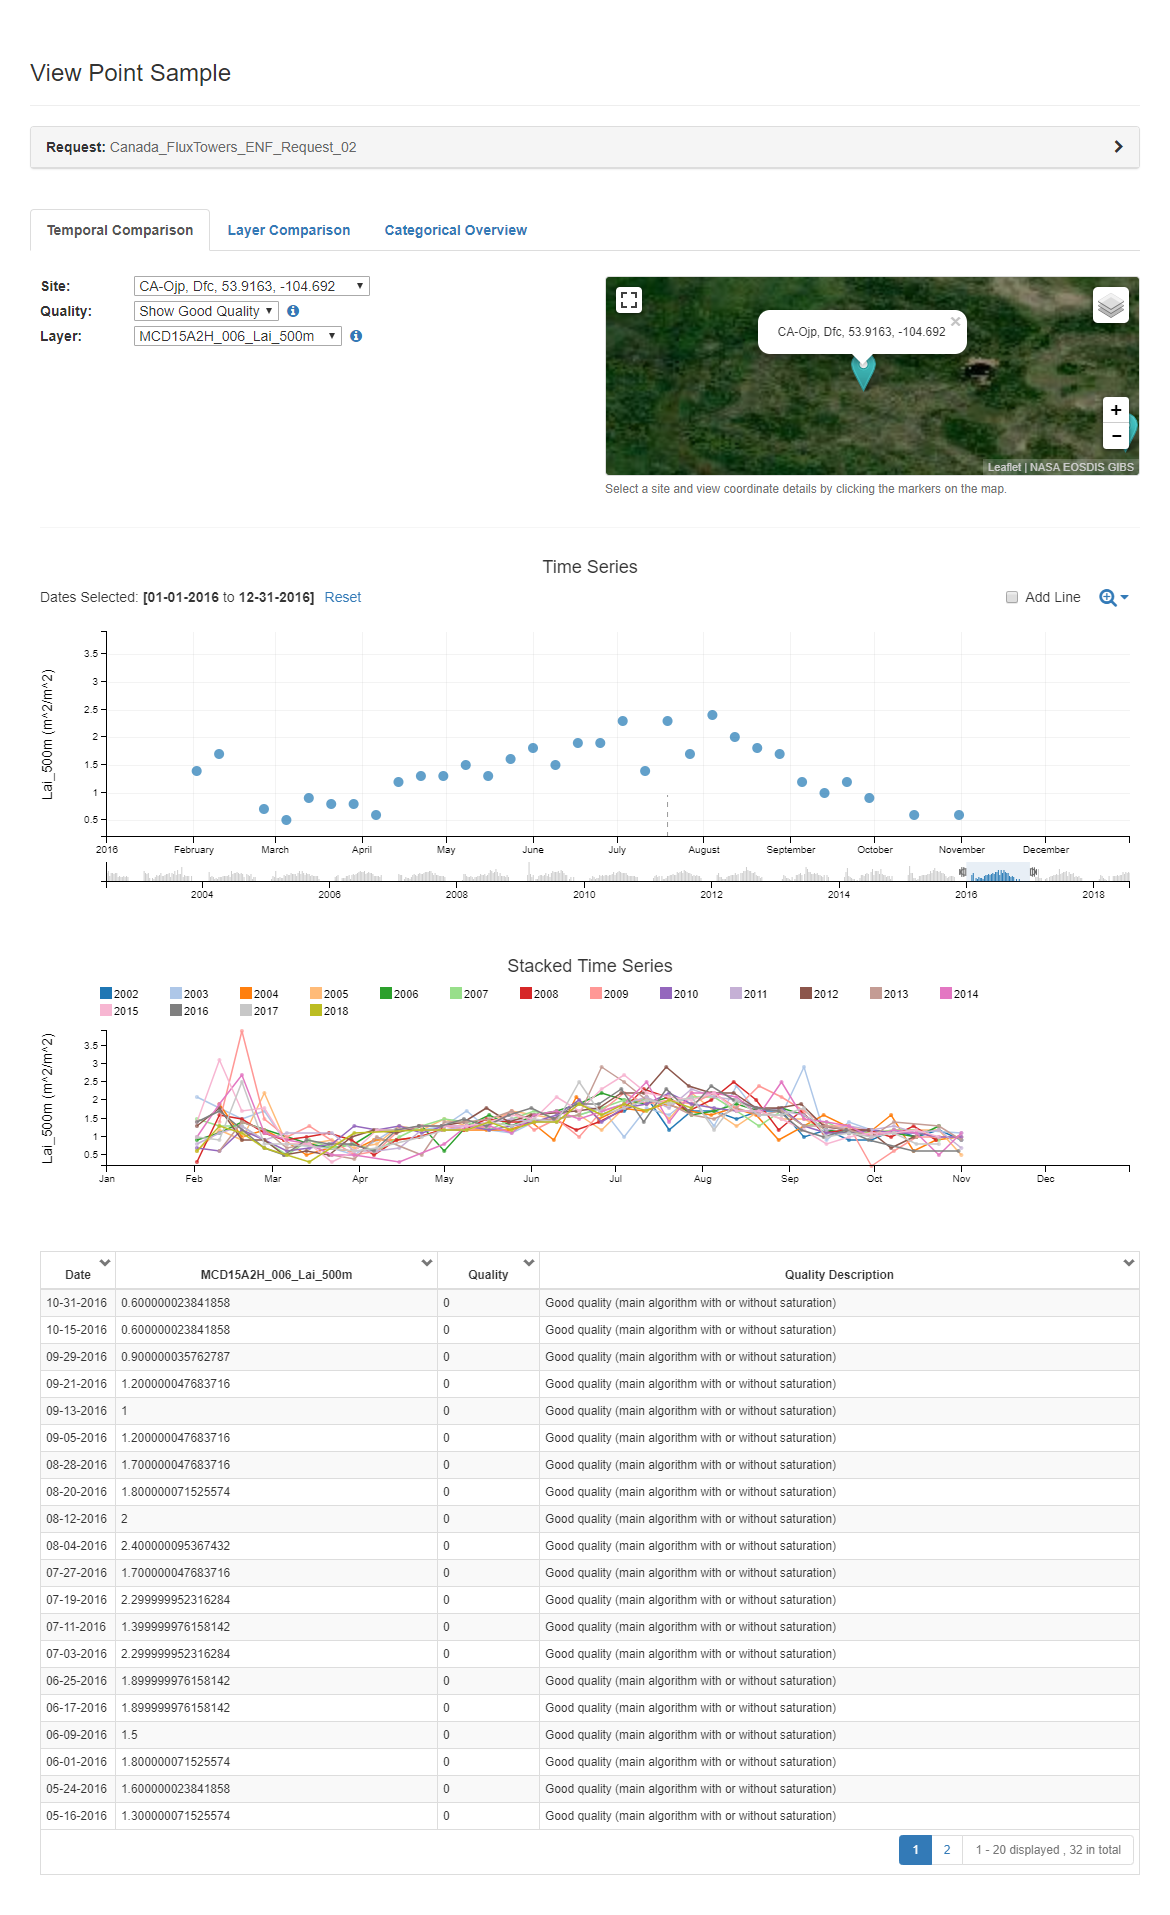
Figure 2b: LAI (MCD15A2H.006) for 2016 at Ameriflux Site CA-Ojp.
Using the AppEEARS visualizations, we can tentatively identify breaks in the temporal trends for LAI, GPP, and ET each site. These breaks could potentially signify some sort of major disturbance (Figure 3). Additionally, we can use the visualizations to evaluate how the environmental variables respond post-disturbance.
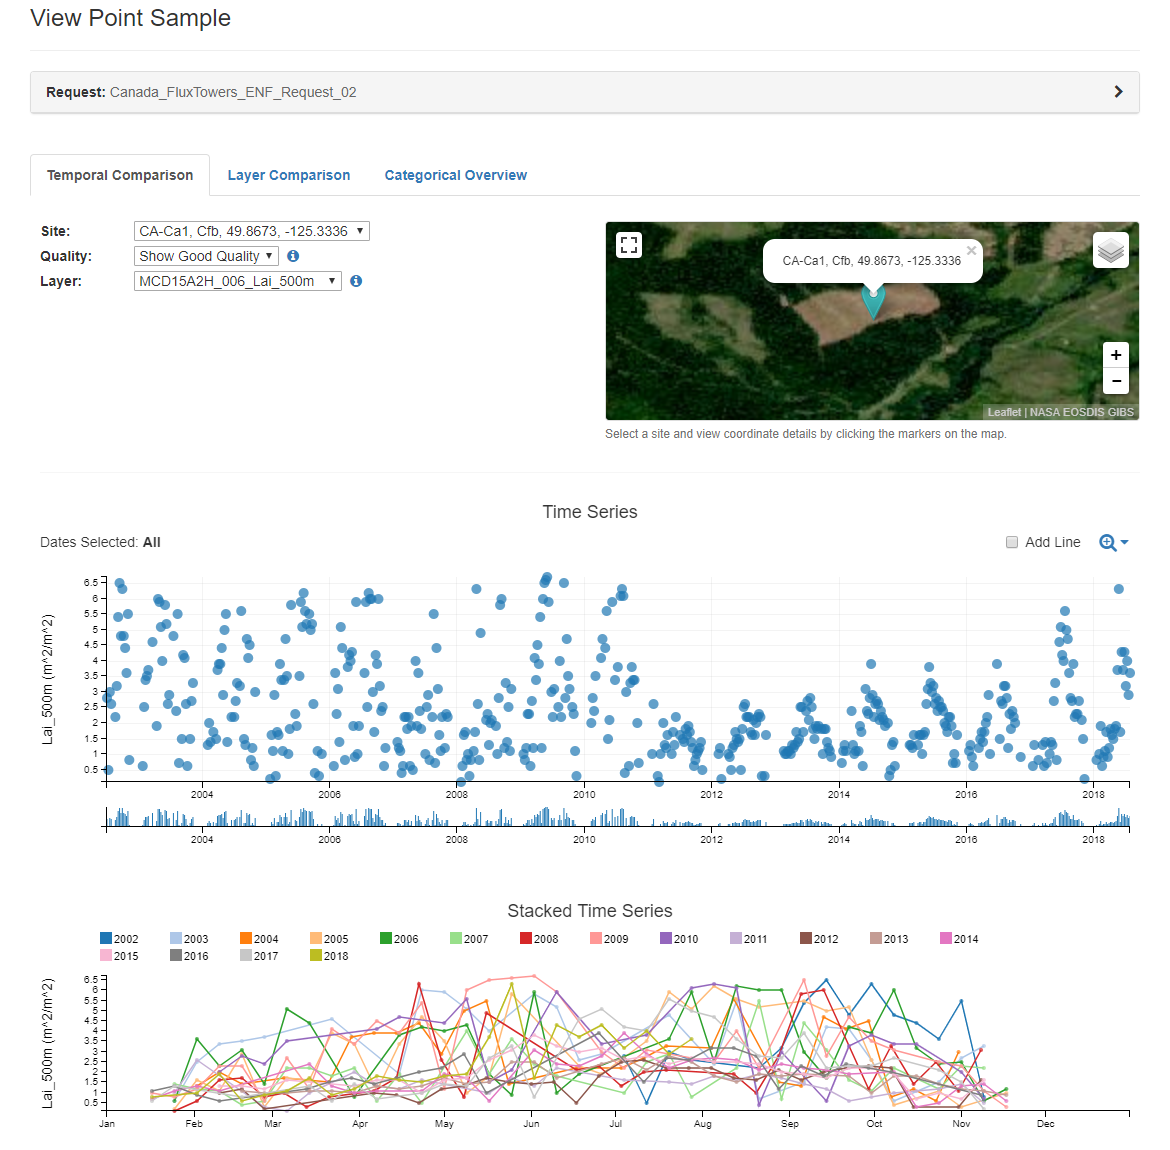
Figure 3: AppEEARS exploratory data visualization of LAI (MCD15A2H.006) from 2002 to 2018 at Ameriflux Site CA-Ca1. The scatterplot shows a sharp decrease in LAI between 2010 and 2011
Finally, AppEEARS’ Categorical Overview visualization gives us the ability to explore data that are aggregated by specific categories (e.g., land cover or climatic classification). If the variable(s) of interest contain an associated data quality data layer, AppEEARS will, by default, provide aggregated statistics for unique quality classifications. Furthermore, AppEEARS will calculate aggregated statistics for two additional user-defined categorical classifications, which are specified at the time of request submission.
The Categorical Overview visualizations for our request show box and whisker plots describing the central tendency and distribution of the aggregated data. In Figure 4, the plots indicate that LAI and GPP tend to, on average, be lower for Dfc sites than for Cfb and Dfb.
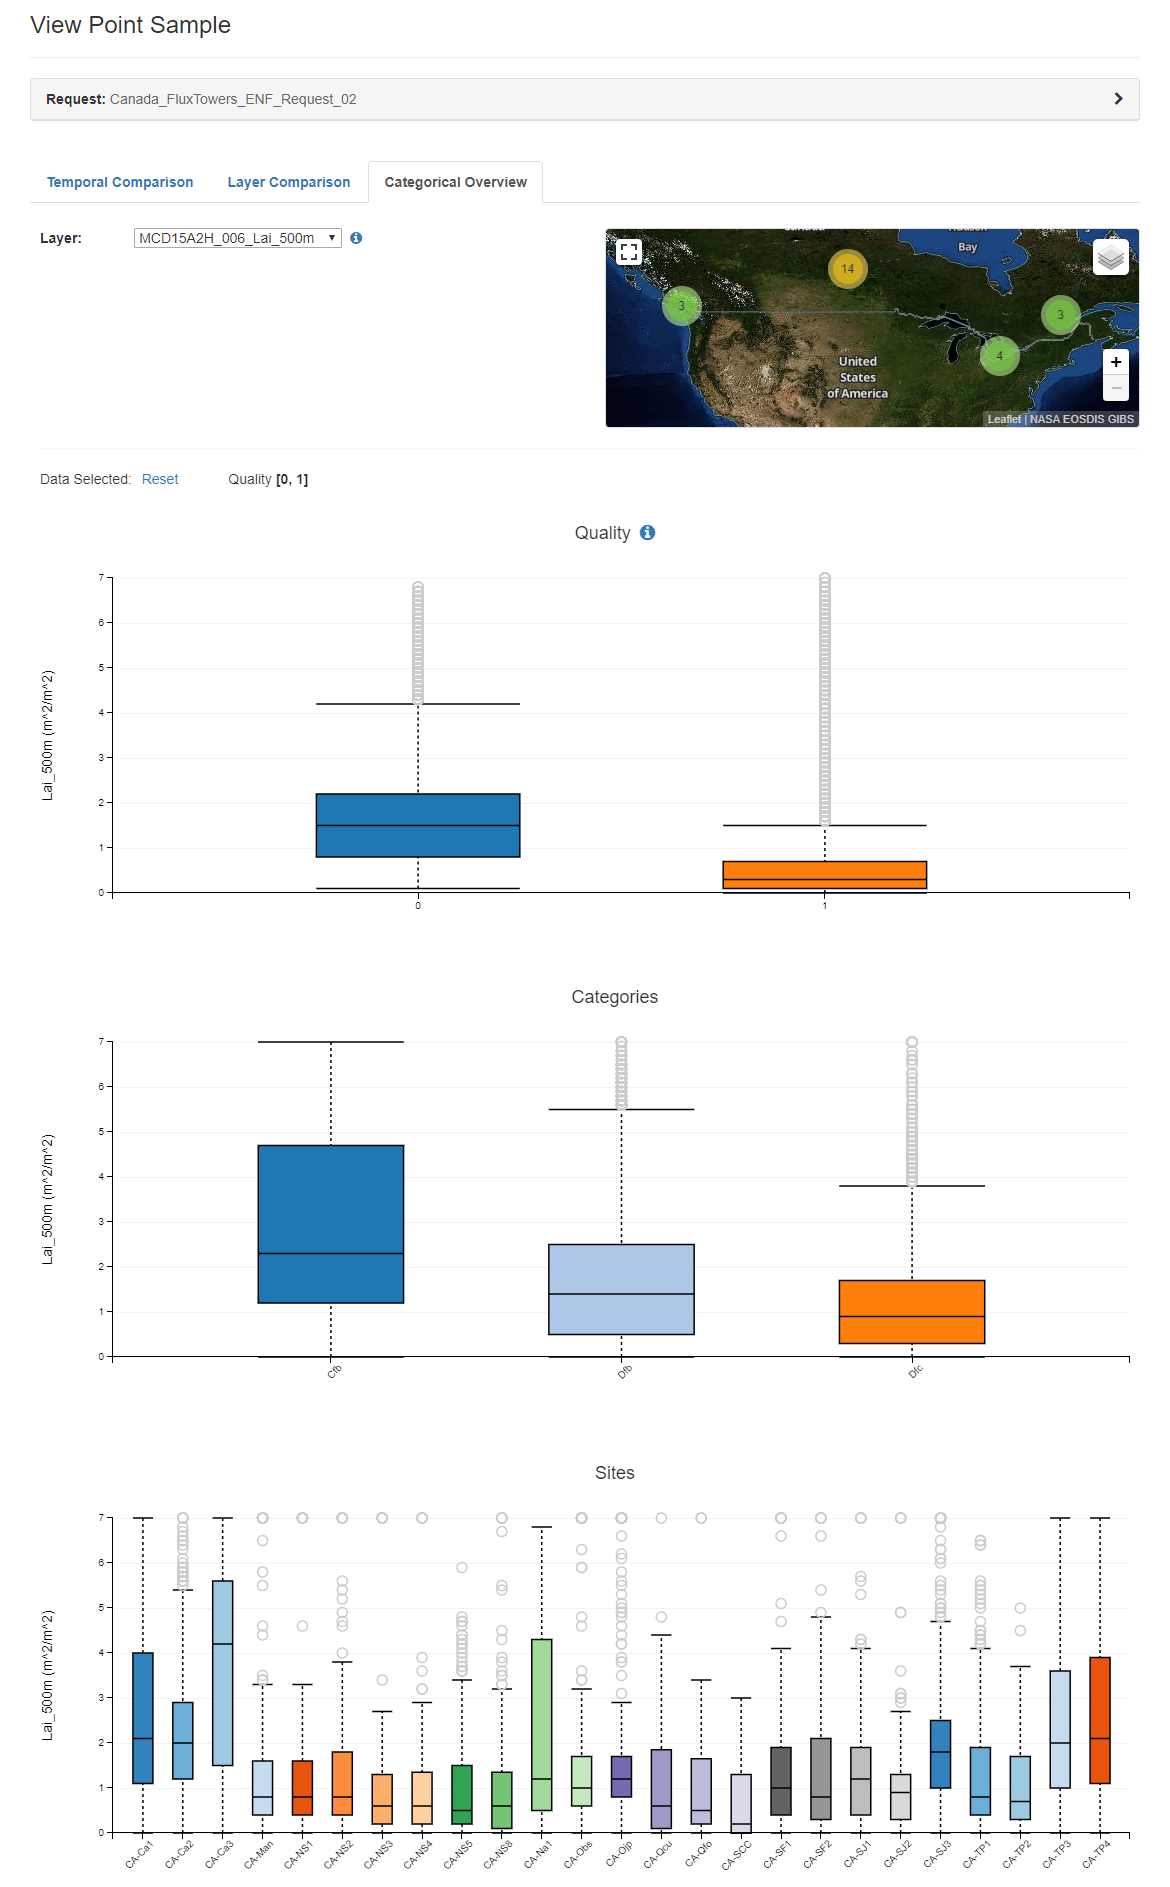
Figure 4: AppEEARS exploratory data visualization – Box and whisker plots showing statistics for each quality classification aggregated through time (top), each climate classification (i.e., Dfc, Cfb, and Dfb) aggregated through time (middle), and individual sites aggregated through time (bottom).
Our example request shows the utility and power of AppEEARS as not only a data extraction tool but also a platform for initial exploratory data analysis. If you are looking to share your request and data with your team, AppEEARS provides a JSON file for each request, which contains the request parameters, thus enabling the ability to replicate the request workflow. The actual request, and resulting output data, are saved to your NASA Earthdata Login profile in AppEEARS for 30 days after the request completes.
AppEEARS not only extracts point samples, as demonstrated above, but also enables users to extract area samples (e.g. vector polygon features). Users can upload a shapefile or geoJSON to AppEEARS, or draw a feature in the viewport map, to request georeferenced time series data in GeoTIFF or NetCDF file formats. More information about both point and area samples, including step-by-step instructions, can be found on the AppEEARS Help page and in this short video. Give it a whirl today!
Written by: Aaron Friesz (Innovate! Inc.) and Lindsey Harriman (SGT, Inc.), contractors to the U.S. Geological Survey Earth Resources Observation and Science (EROS) Center under contract G15PD00467 for the NASA Land Processes Distributed Active Archive Center (LP DAAC) under contract NNG14HH33I.
No Comments
Be the first to start a conversation