
BADM Group Overview
BADM variables in this group are organized as shown below. The overview highlights what variables are required per group. It also indicates which variables cannot be specified together ( OR ) in the same group entry. See BADM Basics for more details.
Multiple entries of this BADM group can be reported per site. However, combinations of Ⓒ variables must be unique. Read more:
| Required | Optional | |||||||||||||||
|---|---|---|---|---|---|---|---|---|---|---|---|---|---|---|---|---|
Basal Area |
|
|
BADM variables: Definitions, Units, Requirements
See Overview tab or BADM Basics for explanation of Required and Optional variables.
Multiple entries of this BADM group can be reported per site. However, combinations of Ⓒ variables must be unique. Read more:
| Variable Requirements | Units | Description |
|---|---|---|
| BASAL_AREARequired | m2 ha-1 | Basal area The area of central tree trunks (stems) measured at 1.3 meters from the soil surface (breast height) for a given land surface area. If reporting basal area at a different height, report the height in Approach. Report the minimum tree size threshold for trees to be included in the mean Basal area measurement in BASAL_AREA_MIN. |
| BASAL_AREA_SPPⒸ Optional-a | Scientific name | Basal area species (taxa) Vegetation species being described by the measurement. To enter a plant species, use the scientific name (Genus species Author or Genus Author). Please refer to www.theplantlist.org for current scientific names and authors. If the measurement includes all vegetation present, do not enter a value. Do not use SPP if reporting VEGTYPE. |
| BASAL_AREA_VEGTYPEⒸ Optional-a | LIST(VEGTYPE) Show | Basal area vegetation type Use the predefined list to indicate the type of vegetation being described by the measurement (e.g., Tree, Evergreen Tree, Deciduous Tree). If the measurement includes all vegetation present, do not enter a value. Not all VEGTYPE options are appropriate for DBH measurement. If vegetation type is not in predfined list, enter "Other/Not in list" and describe briefly in Approach. Do not use VEGTYPE if reporting SPP. |
| BASAL_AREA_STATISTICⒸ Required | LIST(STATISTIC) Show | Basal area statistic The statistic for the measurement reported. Use predefined list (e.g., mean, min / max, standard deviation, etc). |
| BASAL_AREA_STATISTIC_METHODⒸ Optional | LIST(STATISTIC_METHOD) Show | Basal area statistic method Method used to generate the reported statistic (e.g., aggregate of individuals, aggregate of sample aggregates) from observations representing the same time period. Use predefined list. The aggregation method is not meant to describe temporal aggregations for example in calculations of higher frequency observations (e.g., sub-minute) to lower frequency observations (e.g., hourly) at a single location. |
| BASAL_AREA_STATISTIC_NUMBEROptional | integer number | Number of observations used to determine basal area statistic Number of observations (samples / replicates) used to calculate the STATISTIC for the reported measurement. |
| BASAL_AREA_DBH_MINOptional | cm | Minimum tree size (diameter) threshold for basal area measurement The diameter at 1.3m from the soil surface (breast height) above which trees are included in the basal area measurement. |
| BASAL_AREA_APPROACHOptional | free text | Basal area measurement approach |
| BASAL_AREA_DATEⒸ Required-b | YYYYMMDDHHMM | Basal area measurement date Please report the date at the precision known. Allowed reporting precisions are YYYY, YYYYMM, YYYYMMDD, and YYYYMMDDHHMM. For measurements conducted during a campaign or for temporal averages, use DATE_START and DATE_END instead of DATE. |
| BASAL_AREA_DATE_STARTⒸ Required-b | YYYYMMDDHHMM | Start date of basal area measurment Start date of a measurement campaign or start date of a temporal average. Please report the date at the precision known. Allowed reporting precisions are YYYY, YYYYMM, YYYYMMDD, and YYYYMMDDHHMM. Do not use DATE_START if DATE is used. |
| BASAL_AREA_DATE_ENDRequired | YYYYMMDDHHMM | End date of basal area measurment End date of a measurement campaign or end date of a temporal average. Please report the date at the precision known. Allowed reporting precisions are YYYY, YYYYMM, YYYYMMDD, and YYYYMMDDHHMM. Do not use DATE_END if DATE is used. |
| BASAL_AREA_DATE_UNCOptional | days | Uncertainty in the basal area measurement date, start date, and/or end date If uncertainty in the start date differs than end date, report the uncertainty for start date here in DATE_UNC and the uncertainty for end date in Comments. |
| BASAL_AREA_COMMENTOptional | free text | Basal area comments |
BADM Examples
Choose a variable marked with to show examples of how to submit and interpret these BADM. See BADM Basics for more details.
Combinations of Ⓒ variables must be unique. Read more: .
| Basal Area |
SPP and VEGTYPE Variables
Many BADM subgroups and groups have SPP and VEGTYPE variables, like DBH_SPP and DBH_VEGTYPE.
Do not enter values for SPP and VEGTYPE variables together for the same observation, i.e., in the same row of your CSV file. SPP and VEGTYPE are mutually exclusive, optional variables. Read more at BADM Basics.
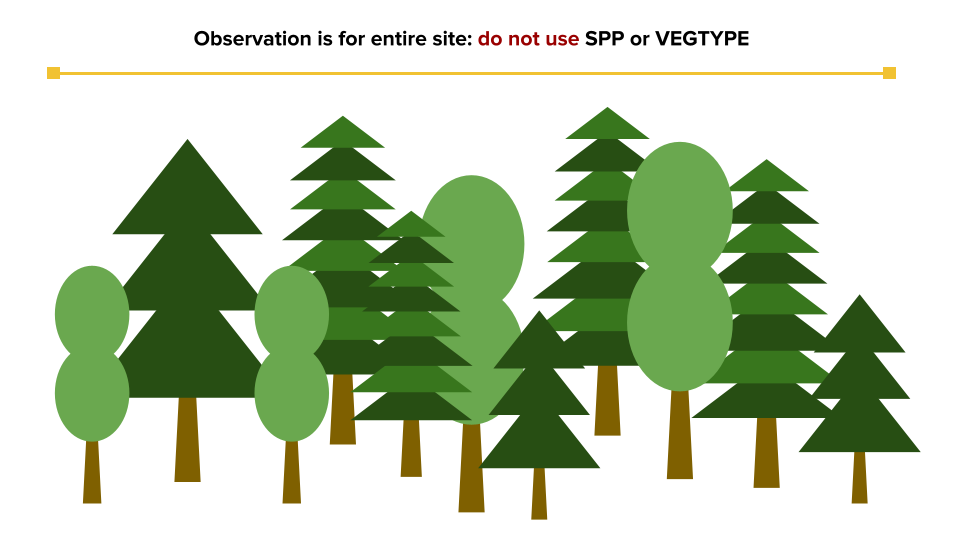
If an observations characterizes the site and is not specific to a single species or to a particular vegetation type, do not enter values for SPP or VEGTYPE:
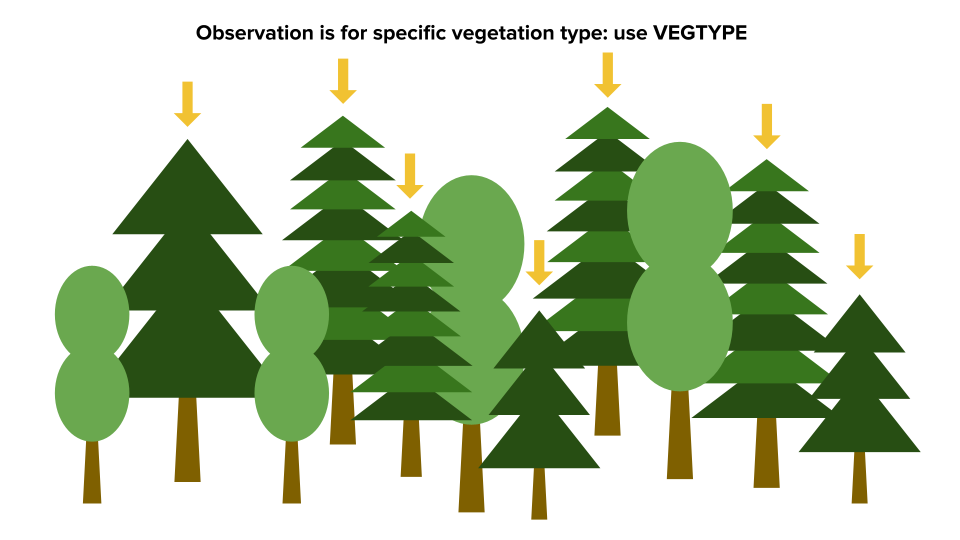
However, if the observation characterizes a single species or a particular vegetation type, use SPP or VEGTYPE, like Evergreen Tree in the example below. Do not use both at the same time!

STATISTIC Variables
Many BADM groups have a required and several optional STATISTIC variables. Specific examples of their use are given after an overview the variables basics.
STATISTIC Basics
BADM typically describe site-level descriptions and observations. The STATISTIC variables allow for full characterization of the reported information if desired. BADM groups, such as canopy height, LAI, soil chemistry, phenology, and biomass, contain the following STATISTIC variables:
| var_STATISTIC Required |
The type of value reported.
Options: |
| var_STATISTIC_METHOD Optional |
The method of aggregation used to generate the statistic.
Options: Statistics generated by this approach may represent spatial characteristics of the measurement within the site (e.g., spatial heterogeneity) and/or characteristics due to other factors (e.g., population variability). Aggregate of sample aggregates Statistics generated by this approach are often used to highlight the spatial characteristics within the site (i.e., the spatial heterogeneity of measurement within the site). Expert estimate See the Examples for more details. |
| var_STATISTIC_NUMBER Optional |
The number of observations used in calculating the statistic. |
STATISTIC Examples
Example 1: DBH calculated from a single sampling area
Example 2: DBH calculated from 8 plots
Example 3: DBH calculated from randomly selected trees within the site
Example 4: Biomass calculated from 8 plots each with 5 sub-plots
Example 5: Soil carbon calculated from replicate samples at 10 locations
Example 1: DBH calculated from a single sampling area
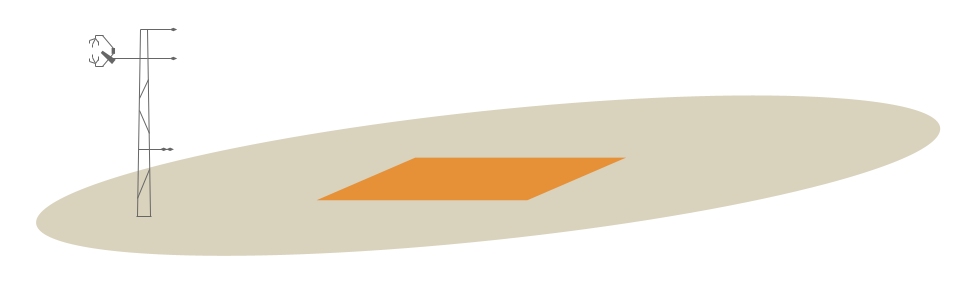
For DBH observations of individual trees in a single sample area at the site:
STATISTIC* = Mean, Minimum, Maximum, Percentiles, or Standard Deviation
STATISTIC_METHOD = Aggregate of individual observations
STATISTIC_NUMBER = # of individual samples
* Minimum, Maximum, and Percentiles should only be calculated if the sample size is adequately large.
Example 2: DBH calculated from 8 plots
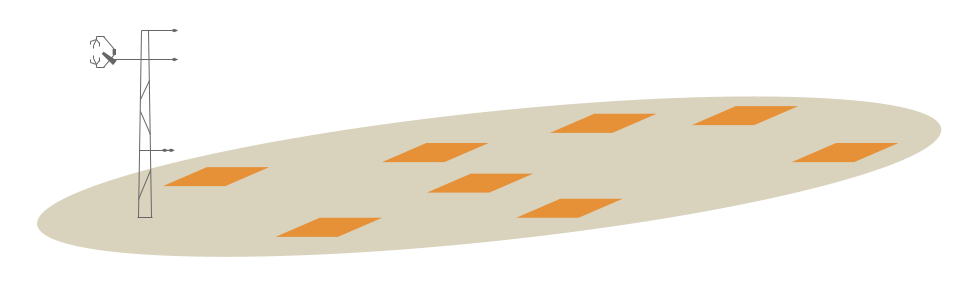
For DBH observations of individual trees in 8 sample plots at the site:
If the individual DBH observations are first aggregated at the plot level and then the plot values are are used to calculate the site-level STATISTICs to highlight spatial variability:
STATISTIC* = Mean, Minimum, Maximum, or Standard Deviation
STATISTIC_METHOD = Aggregate of sample aggregates
STATISTIC_NUMBER = 8
If the individual DBH observations are aggregated across all plots to calculate the site-level STATISTIC:
STATISTIC* = Mean, Minimum, Maximum, Percentiles, or Standard Deviation
STATISTIC_METHOD = Aggregate of individual observations
STATISTIC_NUMBER = # of individual samples
* Minimum, Maximum, and Percentiles should only be calculated if the sample size is adequately large.
Example 3: DBH calculated from randomly selected trees within the site

For DBH observations of individual trees randomly selected at the site:
STATISTIC* = Mean, Minimum, Maximum, Percentiles, or Standard Deviation
STATISTIC_METHOD = Aggregate of individual observations
STATISTIC_NUMBER = # of individual samples
* Minimum, Maximum, and Percentiles should only be calculated if the sample size is adequately large.
Example 4: Biomass calculated from 8 plots each with 5 sub-plots

For Biomass observations collected from 5 sub-plots located in each of 8 sample plots at the site:
In many cases, the sub-plot biomass observations are first aggregated at the plot level. Then the plot values are are used to calculate the site-level STATISTICs:
STATISTIC* = Mean, Minimum, Maximum, or Standard Deviation
STATISTIC_METHOD = Aggregate of sample aggregates
STATISTIC_NUMBER = 8
If pseudo-replication or spatial autocorrelation is not an issue, the sub-plot observations may be aggregated across all plots to calculate the site-level STATISTIC:
STATISTIC* = Mean, Minimum, Maximum, Percentiles, or Standard Deviation
STATISTIC_METHOD = Aggregate of individual observations
STATISTIC_NUMBER = 40
* Minimum, Maximum, and Percentiles should only be calculated if the sample size is adequately large.
Example 5: Soil carbon calculated from replicate samples at 10 locations
For replicate soil carbon observations at 10 randomly-selected points within the site:
To calculate Mean, Minimum, Maximum, Percentiles, and Standard Deviation, the replicates at each location should first be averaged. Then the average values at each location can be used to calculate the STATISTIC:
STATISTIC* = Mean, Minimum, Maximum, Percentiles, or Standard Deviation
STATISTIC_METHOD = Aggregate of sample aggregates
STATISTIC_NUMBER = 10
* Minimum, Maximum, and Percentiles should only be calculated if the sample size is adequately large.
The average difference between the replicates can be used to estimate the Measurement Uncertainty:
STATISTIC = Measurement Uncertainty
STATISTIC_METHOD = Aggregate of individual observations
STATISTIC_NUMBER = 10
DATE Variables
Many groups have several DATE Variables that can be used to describe the time period that the metadata or ancillary data represents.
Dates should be entered at the precision known and most suitable to the observation. Supported precision include year, month, day, and minute in ISO formats: YYYY, YYYYMM, YYYYMMDD, YYYYMMDDHHMM.
DATE or DATE_START / DATE_END
Either a single DATE or a DATE_START / DATE_END pair is required. Do not enter both for the same observation.
- Use DATE when the observation represents a single point in time. Typical resolutions used are a year, month, or day: YYYY, YYYYMM, YYYYMMDD.
- Use DATE_START / DATE_END when the observation represents a period of time. Start and end dates are often used when observations are collected as part of a campaign. Typically resolution is reported with day (YYYYMMDD), but month is also common (YYYYMM).
Notes:
- Do not enter DATE and DATE_START for the same observation. See “Mutually-exclusive variables cannot be submitted together” on BADM Basics: Key Concepts.
- Within a BADM group (e.g., HEIGHTC), different observations cannot be reported for the same DATE and DATE_START. See “Rules for unique variable combinations Ⓒ” on BADM Basics: Key Concepts.
- DATE_END must be reported if DATE_START is reported.
DATE_UNC
Uncertainty in the DATE or DATE_START / DATE_END is an optional variable that can also be reported.
Date uncertainty is most commonly reported when the single DATE variable is used.
Report a date uncertainty that is commensurate with the DATE or DATE_START / DATE_END reported. For example if a day is reported for the DATE, date uncertainty should be on the order of days rather than months or years. If a year is reported for the DATE, date uncertainty should be greater than a year.
Customize and Download CSV for BADM Submission
After selecting your desired variables, download the customized CSV file for submission of BADM. For additional submission details, see BADM Submission Instructions. See BADM Basics for general BADM details.
Multiple entries of this BADM group can be reported per site. However, combinations of Ⓒ variables must be unique. Read more: . See BADM Basics for more details.
| Required | Optional | |||||||||||||||||
|---|---|---|---|---|---|---|---|---|---|---|---|---|---|---|---|---|---|---|
|
|
Submit completed CSV file at Upload Data using the BADM option (login required).