
Yue, X., N. Unger, T. F. Keenan, X. Zhang, and C. S. Vogel. 2015. Probing the past 30-year phenology trend of US deciduous forests. Biogeosciences 12:4693-4709. doi:10.5194/bg-12-4693-2015
“Phenology is experiencing dramatic changes over deciduous forests in the USA. Estimates of trends in phenology on the continental scale are uncertain, however, with studies failing to agree on both the magnitude and spatial distribution of trends in spring and autumn. This is due to the sparsity of in situ records, uncertainties associated with remote sensing data, and the regional focus of many studies…”
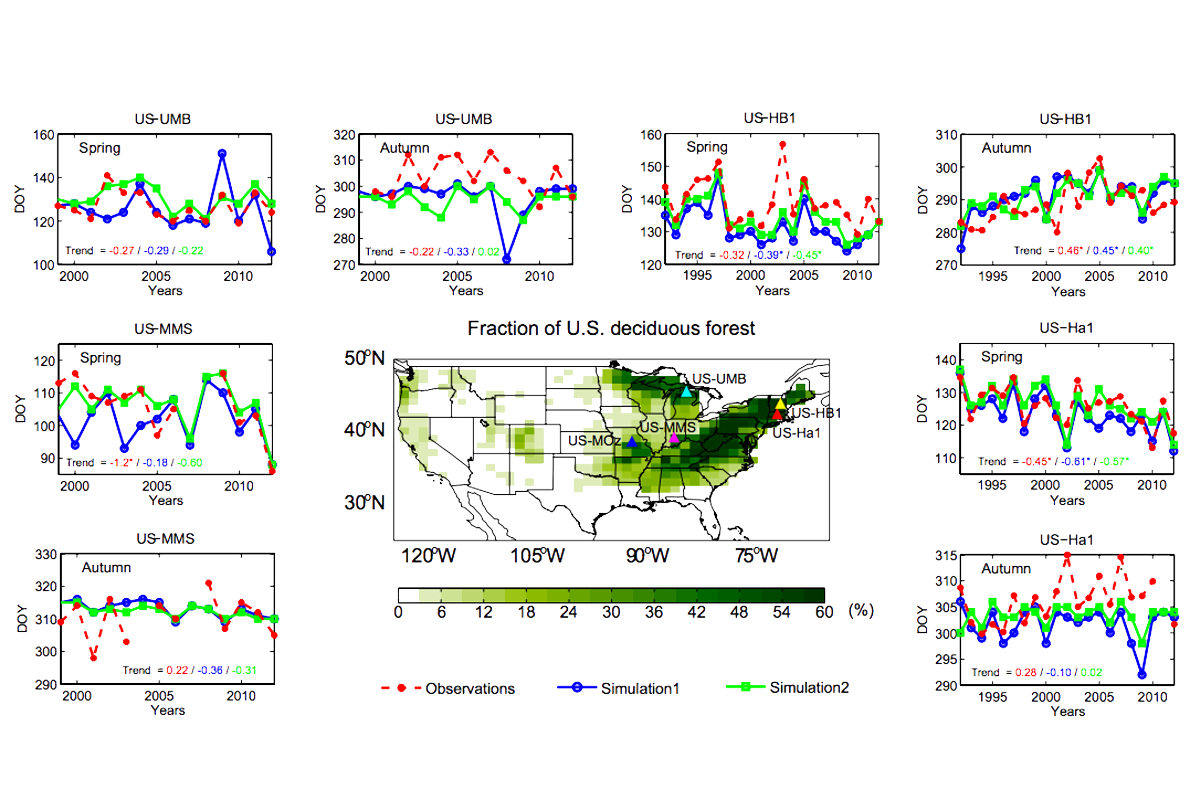
Simulation of spring and autumn phenology at four US deciduous broadleaf forest (DBF) sites. The map shows the fraction of US DBF derived from the Advanced Very High Resolution Radiometer (AVHRR). The area with > 3 % coverage is the domain for this study. Five triangles indicate the locations of sites whose long-term measurements of meteorology and phenology are used for the calibration and/or validation of the model: Harvard Forest (US-Ha1), Hubbard Brook Forest (US-HB1), Morgan–Monroe State Forest (US-MMS), University of Michigan Biological Station Forest (US-UMB), and Missouri Ozark Forest (US-MOz). Phenological dates are recorded at US-Ha1 and US-HB1 during 1992–2012. Measurements of leaf area index (LAI) and photos are used to derive phenology at US-UMB and US-MMS for 1999–2012. Derived phenological dates at US-MOz are used for model calibration but not validation and are not shown here. At each site, two simulations are performed with the spring model S9 and autumn model A4 (refer to Fig. 2), driven by temperatures from either the in situ measurements (blue) or the Modern-Era Retrospective Analysis for Research and Applications (MERRA) reanalysis (green). Trend of each time series (units in day yr−1) is shown with colors indicating results from observations (red) and simulations (blue or green). Significant trends (p < 0.05) are marked with asterisks. (From Yue et al. 2015.)
No Comments
Be the first to start a conversation