
US-Uaf: University of Alaska, Fairbanks
- Overview
- Windroses
- Data Citation
- Data Use Log
- Image Gallery
- Remote Sensing Data
- MODIS
- PhenoCam
- GeoNEX
- Publications
- BADM
| Tower_team: | |
| PI: | Hiroki Iwata hiwata@shinshu-u.ac.jp - Shinshu University |
| PI: | Masahito Ueyama miyabi-flux@muh.biglobe.ne.jp - Osaka Metropolitan University |
| PI: | Yoshinobu Harazono harazono2009gl@gmail.com - Osaka Prefecture University |
| Technician: | Naoki Kukuu naokikukuu@hotmail.com - Wood River Field Services (Contractor) |
| Lat, Long: | 64.8663, -147.8555 |
| Elevation(m): | 155 |
| Network Affiliations: | AmeriFlux |
| Vegetation IGBP: | ENF (Evergreen Needleleaf Forests: Lands dominated by woody vegetation with a percent cover >60% and height exceeding 2 meters. Almost all trees remain green all year. Canopy is never without green foliage.) |
| Climate Koeppen: | Dwc (Subarctic: severe, dry winter, cool summer ) |
| Mean Annual Temp (°C): | -2.9 |
| Mean Annual Precip. (mm): | 263 |
| Flux Species Measured: | CO2, H, H2O, CH4 |
| Years Data Collected: | 2002 - Present |
| Years Data Available: | AmeriFlux BASE 2003 - 2025 Data Citation AmeriFlux FLUXNET 2003 - 2025 Data Citation |
| Data Use Policy: | AmeriFlux CC-BY-4.0 Policy1 |
| Description: | This tower is located near Smith Lake, University of Alaska, Fairbanks. The open black spruce is dominated on discontinuous permafrost. |
| URL: | http://atmenv.envi.osakafu-u.ac.jp/data/uaf_data/ |
| Research Topics: | Long-term monitoring energy & greenhouse gas fluxes under high-latitude climate change |
| Acknowledgment: | Supported by Arctic Challenge for Sustainability (ArCS) project by the Ministry of Education, Culture, Sports, Science and Technology, Japan. |
- This site’s data can also be used under the more restrictive AmeriFlux Legacy Policy.
The AmeriFlux Legacy Policy must be followed if this site’s data are combined with data from sites that require the AmeriFlux Legacy Policy.
Copyright preference: Open use
US-Uaf: University of Alaska, Fairbanks
- Overview
- Windroses
- Data Citation
- Data Use Log
- Image Gallery
- Remote Sensing Data
- MODIS
- PhenoCam
- GeoNEX
- Publications
- BADM
Use the information below for citation of this site. See the Data Policy page for more details.
DOI(s) for citing US-Uaf data
Data Use Policy: AmeriFlux CC-BY-4.0 License
This site’s data can also be used under the more restrictive AmeriFlux Legacy Policy.
The AmeriFlux Legacy Policy must be followed if US-Uaf data are combined with data from sites that require the AmeriFlux Legacy Policy.
- AmeriFlux BASE: https://doi.org/10.17190/AMF/1480322
Citation: Masahito Ueyama, Hiroki Iwata, Yoshinobu Harazono (2026), AmeriFlux BASE US-Uaf University of Alaska, Fairbanks, Ver. 15-5, AmeriFlux AMP, (Dataset). https://doi.org/10.17190/AMF/1480322 - AmeriFlux FLUXNET: https://doi.org/10.17190/AMF/3027325
Citation: Masahito Ueyama, Hiroki Iwata, Yoshinobu Harazono (2026), AmeriFlux FLUXNET-1F US-Uaf University of Alaska, Fairbanks, Ver. v1.3_r1, AmeriFlux AMP, (Dataset). https://doi.org/10.17190/AMF/3027325
Find global FLUXNET datasets, like FLUXNET2015 and FLUXNET-CH4, and their citation information at fluxnet.org.
To cite BADM when downloaded on their own, use the publications below for citing site characterization. When using BADM that are downloaded with AmeriFlux BASE and AmeriFlux FLUXNET products, use the DOI citation for the associated data product.
Publication(s) for citing site characterization
- —
Acknowledgments
- —
Resources
- AmeriFlux Logos & Acknowledgments
US-Uaf: University of Alaska, Fairbanks
- Overview
- Windroses
- Data Citation
- Data Use Log
- Image Gallery
- Remote Sensing Data
- MODIS
- PhenoCam
- GeoNEX
- Publications
- BADM

This page displays the list of downloads of data for the site {{siteId}}.
Note: Results are the number of downloads to distinct data users. The Download Count column indicates the number of times the data user downloaded the data. The Version column refers to the version of the data product for the site that was downloaded by the data user.
| Date | Name | Data Product | Vers. | Intended Use | Intended Use Description | Download Count |
|---|---|---|---|---|---|---|
| {{dlObject.timeStamp}} | {{dlObject.displayName}} | {{displayProduct(dlObject.dataProduct)}} | {{dlObject.version}} | {{dlObject.intendedUse}} | {{dlObject.comment}} | {{dlObject.downloadCounter}} |
Showing {{startItem + 1}} to {{(startItem + items) > filtered.length ? filtered.length : (startItem + items)}} of {{filtered.length}} results
Showing 0 to 0 of 0 results
Not Found
Uh Oh. Something is missing. Try double checking the URL and try again.
US-Uaf: University of Alaska, Fairbanks
- Overview
- Windroses
- Data Citation
- Data Use Log
- Image Gallery
- Remote Sensing Data
- MODIS
- PhenoCam
- GeoNEX
- Publications
- BADM
| AmeriFlux Images | Add Image |
 US-Uaf
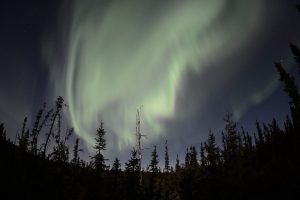
 US-Uaf with northern light
Keywords: —
Location:
View in Original Size
To download, right-click photo (Mac: control-click) and choose Save Image As
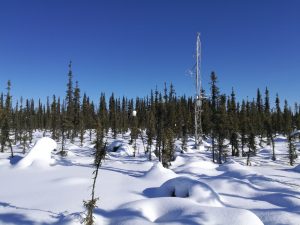
US-Uaf US-Uaf in winter 03/22/2018
Keywords: —
Location: Alaska, United States
View in Original Size
To download, right-click photo (Mac: control-click) and choose Save Image As
 US-Uaf
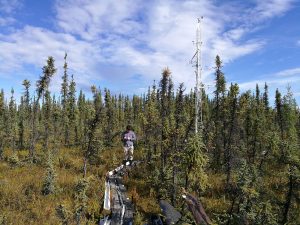
 UAF Site, 2018.08.28
Keywords: US-Ufa
Location: United States
View in Original Size
To download, right-click photo (Mac: control-click) and choose Save Image As
US-Uaf: University of Alaska, Fairbanks
- Overview
- Windroses
- Data Citation
- Data Use Log
- Image Gallery
- Remote Sensing Data
- MODIS
- PhenoCam
- GeoNEX
- Publications
- BADM
| AmeriFlux Publications | Add Publication |
| Year | Publication |
|---|---|
| 2023 | Ueyama, M., Iwata, H., Endo, R., Harazono, Y. (2023) Methane And Carbon Dioxide Emissions From The Forest Floor Of A Black Spruce Forest On Permafrost In Interior Alaska, Polar Science, 35, 100921. https://doi.org/https://doi.org/10.1016/j.polar.2022.100921 |
| 2024 | Ueyama, M., Iwata, H., Nagano, H., Kukuu, N., Harazono, Y. (2024) Anomalous Wet Summers And Rising Atmospheric Co 2 Concentrations Increase The Co 2 Sink In A Poorly Drained Forest On Permafrost, Proceedings Of The National Academy Of Sciences, 121(44), . https://doi.org/https://doi.org/10.1073/pnas.2414539121 |
| 2021 | Chu, H., Luo, X., Ouyang, Z., Chan, W. S., Dengel, S., Biraud, S. C., Torn, M. S., Metzger, S., Kumar, J., Arain, M. A., Arkebauer, T. J., Baldocchi, D., Bernacchi, C., Billesbach, D., Black, T. A., Blanken, P. D., Bohrer, G., Bracho, R., Brown, S., Brunsell, N. A., Chen, J., Chen, X., Clark, K., Desai, A. R., Duman, T., Durden, D., Fares, S., Forbrich, I., Gamon, J. A., Gough, C. M., Griffis, T., Helbig, M., Hollinger, D., Humphreys, E., Ikawa, H., Iwata, H., Ju, Y., Knowles, J. F., Knox, S. H., Kobayashi, H., Kolb, T., Law, B., Lee, X., Litvak, M., Liu, H., Munger, J. W., Noormets, A., Novick, K., Oberbauer, S. F., Oechel, W., Oikawa, P., Papuga, S. A., Pendall, E., Prajapati, P., Prueger, J., Quinton, W. L., Richardson, A. D., Russell, E. S., Scott, R. L., Starr, G., Staebler, R., Stoy, P. C., Stuart-Haëntjens, E., Sonnentag, O., Sullivan, R. C., Suyker, A., Ueyama, M., Vargas, R., Wood, J. D., Zona, D. (2021) Representativeness Of Eddy-Covariance Flux Footprints For Areas Surrounding Ameriflux Sites, Agricultural And Forest Meteorology, 301-302, 108350. https://doi.org/10.1016/j.agrformet.2021.108350 |
| 2020 | Ueyama, M., Yamamori, T., Iwata, H., Harazono, Y. (2020) Cooling And Moistening Of The Planetary Boundary Layer In Interior Alaska Due To A Postfire Change In Surface Energy Exchange, Journal Of Geophysical Research: Atmospheres, 125(18), . https://doi.org/10.1029/2020JD032968 |
| 2018 | Masahito UEYAMA, Narumi TAHARA, Hirohiko NAGANO, Naoki MAKITA, Hiroki IWATA, Yoshinobu HARAZONO (2018) Leaf- and ecosystem-scale photosynthetic parameters for the overstory and understory of boreal forests in interior Alaska, journal of Agricultural Meteorology, 74(2), 79-86. |
| 2016 | Ueyama, M., Tahara, N., Iwata, H., Euskirchen, E. S., Ikawa, H., Kobayashi, H., Nagano, H., Nakai, T., and Harazono, Y. (2016) Optimization of a biochemical model with eddy covariance measurements in black spruce forests of Alaska for estimating CO2 fertilization effects, Agric. Forest Meteorol., 222, 98-111. |
| 2015 | Iwata, H., Harazono, Y., Ueyama, M., Sakabe, A., Nagano H., Kosugi, Y., Takahashi, K., and Kim, Y. (2015) Methane exchange in a poorly-drained black spruce forest over permafrost observed using the eddy covariance technique, Agric. Forest Meteorol., 214-215, 157-168. |
| 2015 | Harazono, Y., Iwata, H., Sakabe, A., Ueyama, M., Takahashi, K., Nagano, H., Nakai, T., and Kosugi, Y. (2015) Effects of water vapor dilution on trace gas flux, and practical correction methods, J. Agric. Meteorol., 71, 65-76. |
| 2014 | Ueyama, M., Kudo, S., Iwama, C., Nagano, H., Kobayashi, H., Harazono, Y. and Yoshikawa, K. (2014) Does summer warming reduce black spruce productivity in interior Alaska?, J. Forest Res., 20, 52-59. |
| 2014 | Ueyama, M., Iwata, H., Harazono, Y. (2014) Autumn Warming Reduces The Co2sink Of A Black Spruce Forest In Interior Alaska Based On A Nine-Year Eddy Covariance Measurement, Global Change Biology, 20(4), 1161-1173. https://doi.org/doi:10.1111/gcb.12434 |
| 2012 | Iwata, H., Harazono, Y., and Ueyama, M. (2012) Sensitivity and offset changes of a fast-response open-path infrared gas analyzer during long-term observations in an Arctic environment, J. Agric. Meteorol., 68, 175-181. |
| 2010 | Ueyama, M., Harazono, Y., and Ichii, K. (2010) Satellite-based modeling of the carbon fluxes in mature black spruce forests in Alaska: a synthesis of the eddy covariance data and satellite remote sensing data, 2010, 14, 1-27. |
| 2010 | Iwata, H., Harazono, Y., and Ueyama, M. (2010) Influence of source/sink distributions on flux-gradient relationships in the roughtness sublayer over an open forest canopy under unstable conditions, Boundary Layer Meteorol., 136, 391-405. |
| 2009 | Ueyama, M., Harazono, Y., Kim, Y. and Tanaka, N. (2009) Response of the carbon cycle in sub-arctic black spruce forests to climate change: Reduction of a carbon sink related to the sensitivity of heterotrophic respiration., Agric. Forest Meteorol., 149, 582-602. |
| 2009 | Date, T., Ueyama. M., Harazono, Y., Ota, Y., Iwata, T. and Yamamoto, S. (2009) Satellite observations of decadal scale CO2 fluxes over black spruce forests in Alaska associated with climate variability., J. Agric. Meteorol., 65, 47-60. |
| 2007 | Kitamoto, T., Ueyama, M., Harazono, Y., Iwata, T. and Yamamoto, S. (2007) Applications of NOAA/AVHRR and observed fluxes to estimate regional carbon fluxes over black spruce forests in Alaska., J. Agric. Meteorol., 63, 171-183. |
| 2012 | Iwata, H., Harazono, Y., and Ueyama, M. (2012) The role of permafrost on water exchange of a black spruce forest in Interior Alaska, Agric. Forest Meteorol., 161(107-115), . |
| 2007 | Kim, Y., Ueyama, M., Nakagawa, F., Tsunogai, U., Harazono, Y. and Tanaka, N. (2007) Assessment of winter fluxes of CO2 and CH4 in boreal forest soils of central Alaska estimated by the profile method and the chamber method: A diagnosis of methane emission and implications for the regional carbon budget, Tellus, 59B, 223-233. |
| 2006 | Ueyama, M., Harazaono, Y., Okada, R., Nojiri, A., Ohtaki, E. and Miyata, A. (2006) Micrometeorological measurements of methane flux at a boreal forest in central Alaska, Mem. Natl Inst. Polar Res., Spec. Issue, 59, 156-167. |
| 2006 | Ueyama, M., Harazono, Y., Okada, R., Nojiri, A., Ohataki, E. and Miyata, A. (2006) Controlling factors on the inter-annual CO2 budget at a sub-arctic black spruce forest in interior Alaska, Tellus, 58B, 491-501. |
US-Uaf: University of Alaska, Fairbanks
- Overview
- Windroses
- Data Citation
- Data Use Log
- Image Gallery
- Remote Sensing Data
- MODIS
- PhenoCam
- GeoNEX
- Publications
- BADM
BADM for This Site
Access the Biological, Ancillary, Disturbance and Metadata (BADM) information and data for this site.
BADM contain information for many uses, such as characterizing a site’s vegetation and soil, describing disturbance history, and defining instrumentation for flux processing. They complement the flux/met data.
- Download BADM for this site*
- View Site General Info for this site (Overview tab)*
- Use Online Editor to update Site General Info or DOI Authorship
- Update information about submitted data (Variable Information tool)
- More BADM resources
* Online updates are shown on the Overview tab real time. However, downloaded BADM files will not reflect those updates until they have been reviewed for QA/QC.
US-Uaf: University of Alaska, Fairbanks
- Overview
- Windroses
- Data Citation
- Data Use Log
- Image Gallery
- Remote Sensing Data
- MODIS
- PhenoCam
- GeoNEX
- Publications
- BADM
Wind Roses
Wind Speed (m/s)
- Wind Speed Scale: Per Site
- Wind Direction Scale (%): Per Site
- Wind Speed Scale: Non-Linear
- Wind Direction Scale (%): AmeriFlux