
US-Twt: Twitchell Island
- Overview
- Windroses
- Data Citation
- Data Use Log
- Image Gallery
- Remote Sensing Data
- MODIS
- PhenoCam
- GeoNEX
- Publications
- BADM
| Tower_team: | |
| PI: | Dennis Baldocchi baldocchi@berkeley.edu - University of California, Berkeley |
| AncContact: | Daphne Szutu daphneszutu@berkeley.edu - UC Berkeley |
| AncContact: | Joe Verfaillie jverfail@berkeley.edu - University of California, Berkeley |
| Lat, Long: | 38.1087, -121.6531 |
| Elevation(m): | -7 |
| Network Affiliations: | AmeriFlux, Phenocam |
| Vegetation IGBP: | CRO (Croplands: Lands covered with temporary crops followed by harvest and a bare soil period (e.g., single and multiple cropping systems). Note that perennial woody crops will be classified as the appropriate forest or shrub land cover type.) |
| Climate Koeppen: | Csa (Mediterranean: mild with dry, hot summer) |
| Mean Annual Temp (°C): | 15.6 |
| Mean Annual Precip. (mm): | 421 |
| Flux Species Measured: | CO2, CH4, H2O |
| Years Data Collected: | 2009 - 2017 |
| Years Data Available: | AmeriFlux BASE 2009 - 2017 Data Citation AmeriFlux FLUXNET 2009 - 2017 Data Citation |
| Data Use Policy: | AmeriFlux CC-BY-4.0 Policy1 |
| Description: | |
| URL: | http://nature.berkeley.edu/biometlab/fielddescription.html |
| Research Topics: | |
| Acknowledgment: | California Department of Water Resources; USDA/AFRI |
- This site’s data can also be used under the more restrictive AmeriFlux Legacy Policy.
The AmeriFlux Legacy Policy must be followed if this site’s data are combined with data from sites that require the AmeriFlux Legacy Policy.
Copyright preference: As long as credit is given
US-Twt: Twitchell Island
- Overview
- Windroses
- Data Citation
- Data Use Log
- Image Gallery
- Remote Sensing Data
- MODIS
- PhenoCam
- GeoNEX
- Publications
- BADM
Use the information below for citation of this site. See the Data Policy page for more details.
DOI(s) for citing US-Twt data
Data Use Policy: AmeriFlux CC-BY-4.0 License
This site’s data can also be used under the more restrictive AmeriFlux Legacy Policy.
The AmeriFlux Legacy Policy must be followed if US-Twt data are combined with data from sites that require the AmeriFlux Legacy Policy.
- AmeriFlux BASE: https://doi.org/10.17190/AMF/1246140
Citation: Sara Knox, Jaclyn Hatala Matthes, Joseph Verfaillie, Dennis Baldocchi (2023), AmeriFlux BASE US-Twt Twitchell Island, Ver. 7-5, AmeriFlux AMP, (Dataset). https://doi.org/10.17190/AMF/1246140 - AmeriFlux FLUXNET: https://doi.org/10.17190/AMF/2571105
Citation: Sara Knox, Jaclyn Hatala Matthes, Joseph Verfaillie, Dennis Baldocchi (2026), AmeriFlux FLUXNET-1F US-Twt Twitchell Island, Ver. v1.3_r1, AmeriFlux AMP, (Dataset). https://doi.org/10.17190/AMF/2571105
Find global FLUXNET datasets, like FLUXNET2015 and FLUXNET-CH4, and their citation information at fluxnet.org.
To cite BADM when downloaded on their own, use the publications below for citing site characterization. When using BADM that are downloaded with AmeriFlux BASE and AmeriFlux FLUXNET products, use the DOI citation for the associated data product.
Publication(s) for citing site characterization
- —
Acknowledgments
- —
Resources
- AmeriFlux Logos & Acknowledgments
US-Twt: Twitchell Island
- Overview
- Windroses
- Data Citation
- Data Use Log
- Image Gallery
- Remote Sensing Data
- MODIS
- PhenoCam
- GeoNEX
- Publications
- BADM

This page displays the list of downloads of data for the site {{siteId}}.
Note: Results are the number of downloads to distinct data users. The Download Count column indicates the number of times the data user downloaded the data. The Version column refers to the version of the data product for the site that was downloaded by the data user.
| Date | Name | Data Product | Vers. | Intended Use | Intended Use Description | Download Count |
|---|---|---|---|---|---|---|
| {{dlObject.timeStamp}} | {{dlObject.displayName}} | {{displayProduct(dlObject.dataProduct)}} | {{dlObject.version}} | {{dlObject.intendedUse}} | {{dlObject.comment}} | {{dlObject.downloadCounter}} |
Showing {{startItem + 1}} to {{(startItem + items) > filtered.length ? filtered.length : (startItem + items)}} of {{filtered.length}} results
Showing 0 to 0 of 0 results
Not Found
Uh Oh. Something is missing. Try double checking the URL and try again.
US-Twt: Twitchell Island
- Overview
- Windroses
- Data Citation
- Data Use Log
- Image Gallery
- Remote Sensing Data
- MODIS
- PhenoCam
- GeoNEX
- Publications
- BADM
| AmeriFlux Images | Add Image |
 US-Twt
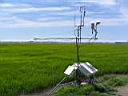
 Twitchell Island Rice Field
flux tower and veg and fetch
Keywords: —
Location: California, United States
View in Original Size
To download, right-click photo (Mac: control-click) and choose Save Image As
 US-Twt
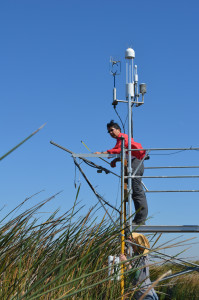
 Deb Agarwal, AMP Data Lead, measures instrument distances at US-Twt.
Keywords: —
Location: California, United States
View in Original Size
To download, right-click photo (Mac: control-click) and choose Save Image As
 US-Twt
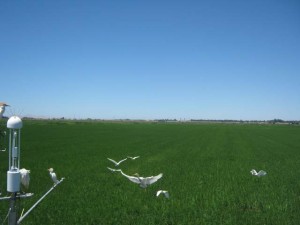
 Twitchell Island Rice Field and Egrets
Keywords: —
Location: California, United States
View in Original Size
To download, right-click photo (Mac: control-click) and choose Save Image As
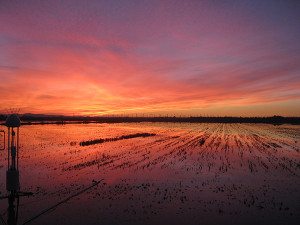
US-Twt Delta Sunset
Keywords: —
Location: California, United States
View in Original Size
To download, right-click photo (Mac: control-click) and choose Save Image As
US-Twt: Twitchell Island
- Overview
- Windroses
- Data Citation
- Data Use Log
- Image Gallery
- Remote Sensing Data
- MODIS
- PhenoCam
- GeoNEX
- Publications
- BADM
MODIS NDVI
The time series shows the 16-day Normalized Difference Vegetation Index (NDVI) average from the MOD13Q1 data product.
Use the slider below the time series to zoom in and out.
To view / download these data and other MOD13Q1 products for this site, visit MODIS/Terra Vegetation Indices.
For other related products, visit MODIS/VIIRS Fixed Sites Subsets Tool.
Citation:
ORNL DAAC. 2018. Terrestrial Ecology Subsetting & Visualization Services (TESViS) Fixed Sites Subsets. ORNL DAAC, Oak Ridge, Tennessee, USA. https://doi.org/10.3334/ORNLDAAC/1567
MODIS NDVI subsetted data is not yet available for this site.
For a complete list of AmeriFlux sites, visit ORNL DAAC's MODIS/VIIRS Fixed Sites Subsets Tool.


US-Twt: Twitchell Island
- Overview
- Windroses
- Data Citation
- Data Use Log
- Image Gallery
- Remote Sensing Data
- MODIS
- PhenoCam
- GeoNEX
- Publications
- BADM
| AmeriFlux Publications | Add Publication |
| Year | Publication |
|---|---|
| 2021 | Chu, H., Luo, X., Ouyang, Z., Chan, W. S., Dengel, S., Biraud, S. C., Torn, M. S., Metzger, S., Kumar, J., Arain, M. A., Arkebauer, T. J., Baldocchi, D., Bernacchi, C., Billesbach, D., Black, T. A., Blanken, P. D., Bohrer, G., Bracho, R., Brown, S., Brunsell, N. A., Chen, J., Chen, X., Clark, K., Desai, A. R., Duman, T., Durden, D., Fares, S., Forbrich, I., Gamon, J. A., Gough, C. M., Griffis, T., Helbig, M., Hollinger, D., Humphreys, E., Ikawa, H., Iwata, H., Ju, Y., Knowles, J. F., Knox, S. H., Kobayashi, H., Kolb, T., Law, B., Lee, X., Litvak, M., Liu, H., Munger, J. W., Noormets, A., Novick, K., Oberbauer, S. F., Oechel, W., Oikawa, P., Papuga, S. A., Pendall, E., Prajapati, P., Prueger, J., Quinton, W. L., Richardson, A. D., Russell, E. S., Scott, R. L., Starr, G., Staebler, R., Stoy, P. C., Stuart-Haëntjens, E., Sonnentag, O., Sullivan, R. C., Suyker, A., Ueyama, M., Vargas, R., Wood, J. D., Zona, D. (2021) Representativeness Of Eddy-Covariance Flux Footprints For Areas Surrounding Ameriflux Sites, Agricultural And Forest Meteorology, 301-302, 108350. https://doi.org/10.1016/j.agrformet.2021.108350 |
| 2019 | Kim, Y., Johnson, M. S., Knox, S. H., Black, T. A., Dalmagro, H. J., Kang, M., Kim, J., Baldocchi, D. (2019) Gap‐Filling Approaches For Eddy Covariance Methane Fluxes: A Comparison Of Three Machine Learning Algorithms And A Traditional Method With Principal Component Analysis, Global Change Biology, . https://doi.org/10.1111/gcb.14845 |
| 2019 | Sullivan, R. C., Kotamarthi, V. R., Feng, Y. (2019) Recovering Evapotranspiration Trends From Biased CMIP5 Simulations And Sensitivity To Changing Climate Over North America, Journal Of Hydrometeorology, 20(8), 1619-1633. https://doi.org/10.1175/JHM-D-18-0259.1 |
| 2019 | Sullivan, R. C., Cook, D. R., Ghate, V. P., Kotamarthi, V. R., Feng, Y. (2019) Improved Spatiotemporal Representativeness And Bias Reduction Of Satellite-Based Evapotranspiration Retrievals Via Use Of In Situ Meteorology And Constrained Canopy Surface Resistance, Journal Of Geophysical Research: Biogeosciences, 124(2), 342-352. https://doi.org/10.1029/2018JG004744 |
| 2019 | Hemes, K. S., Chamberlain, S. D., Eichelmann, E., Anthony, T., Valach, A., Kasak, K., Szutu, D., Verfaillie, J., Silver, W. L., Baldocchi, D. D. (2019) Assessing The Carbon And Climate Benefit Of Restoring Degraded Agricultural Peat Soils To Managed Wetlands, Agricultural And Forest Meteorology, 268, 202-214. https://doi.org/10.1016/j.agrformet.2019.01.017 |
| 2018 | Baldocchi, D., Penuelas, J. (2018) The Physics And Ecology Of Mining Carbon Dioxide From The Atmosphere By Ecosystems, Global Change Biology, . https://doi.org/10.1111/gcb.14559 |
| 2018 | Chu, H., Baldocchi, D. D., Poindexter, C., Abraha, M., Desai, A. R., Bohrer, G., Arain, M. A., Griffis, T., Blanken, P. D., O'Halloran, T. L., Thomas, R. Q., Zhang, Q., Burns, S. P., Frank, J. M., Christian, D., Brown, S., Black, T. A., Gough, C. M., Law, B. E., Lee, X., Chen, J., Reed, D. E., Massman, W. J., Clark, K., Hatfield, J., Prueger, J., Bracho, R., Baker, J. M., Martin, T. A. (2018) Temporal Dynamics Of Aerodynamic Canopy Height Derived From Eddy Covariance Momentum Flux Data Across North American Flux Networks, Geophysical Research Letters, 45, 9275–9287. https://doi.org/10.1029/2018GL079306 |
| 2018 | Eichelmann, E., Hemes, K. S., Knox, S. H., Oikawa, P. Y., Chamberlain, S. D., Sturtevant, C., Verfaillie, J., Baldocchi, D. D. (2018) The Effect Of Land Cover Type And Structure On Evapotranspiration From Agricultural And Wetland Sites In The Sacramento–San Joaquin River Delta, California, Agricultural And Forest Meteorology, 256-257, 179-195. https://doi.org/10.1016/j.agrformet.2018.03.007 |
| 2017 | Chamberlain, S. D., Verfaillie, J., Eichelmann, E., Hemes, K. S., Baldocchi, D. D. (2017) Evaluation Of Density Corrections To Methane Fluxes Measured By Open-Path Eddy Covariance Over Contrasting Landscapes, Boundary-Layer Meteorology, . https://doi.org/10.1007/s10546-017-0275-9 |
| 2016 | Baldocchi, D., S. Knox, I. Dronova, J. Verfaillie, P. Oikawa, C. Sturtevant, J. H. Matthes, and M. Detto. (2016) The impact of expanding flooded land area on the annual evaporation of rice. Agricultural and Forest Meteorology, Agricultural and Forest Meteorology, 223, 181-193. https://doi.org/https://dx.doi.org/10.1016/j.agrformet.2016.04.001 |
| 2016 | Knox, S. H., J. H. Matthes, C. Sturtevant, P. Y. Oikawa, J. Verfaillie, and D. Baldocchi. (2016) Biophysical controls on interannual variability in ecosystem-scale CO2 and CH4 exchange in a California rice paddy., Journal of Geophysical Research-Biogeosciences, 121, 978-1001. https://doi.org/10.1002/2015JG003247 |
| 2012 | Hatala, J. A., Detto, M., Sonnentag, O., Deverel, S. J., Verfaillie, J., Baldocchi, D. D. (2012) Greenhouse Gas (CO2, CH4, H2O) Fluxes From Drained And Flooded Agricultural Peatlands In The Sacramento-San Joaquin Delta, Agriculture, Ecosystems & Environment, 150, 1-18. https://doi.org/10.1016/j.agee.2012.01.009 |
| 2012 | Hatala, J. A., Detto, M., Baldocchi, D. D. (2012) Gross Ecosystem Photosynthesis Causes A Diurnal Pattern In Methane Emission From Rice, Geophysical Research Letters, 39(6), n/a-n/a. https://doi.org/10.1029/2012gl051303 |
| 2014 | Knox, S. H.,, Sturtevant, C., Matthes, J.H., Koteen, L., Verfaillie,J., Baldocchi. D. (2014) Agricultural peatland restoration: effects of land-use change on greenhouse gas (CO2 and CH4) fluxes in the Sacramento-San Joaquin Delta, Global Change Biology, 21, 750-765. https://doi.org/10.1111/gcb.12745 |
US-Twt: Twitchell Island
- Overview
- Windroses
- Data Citation
- Data Use Log
- Image Gallery
- Remote Sensing Data
- MODIS
- PhenoCam
- GeoNEX
- Publications
- BADM
BADM for This Site
Access the Biological, Ancillary, Disturbance and Metadata (BADM) information and data for this site.
BADM contain information for many uses, such as characterizing a site’s vegetation and soil, describing disturbance history, and defining instrumentation for flux processing. They complement the flux/met data.
- Download BADM for this site*
- View Site General Info for this site (Overview tab)*
- Use Online Editor to update Site General Info or DOI Authorship
- Update information about submitted data (Variable Information tool)
- More BADM resources
* Online updates are shown on the Overview tab real time. However, downloaded BADM files will not reflect those updates until they have been reviewed for QA/QC.
US-Twt: Twitchell Island
- Overview
- Windroses
- Data Citation
- Data Use Log
- Image Gallery
- Remote Sensing Data
- MODIS
- PhenoCam
- GeoNEX
- Publications
- BADM
Wind Roses
Wind Speed (m/s)
- Wind Speed Scale: Per Site
- Wind Direction Scale (%): Per Site
- Wind Speed Scale: Non-Linear
- Wind Direction Scale (%): AmeriFlux