
US-SRS: Santa Rita Savanna
- Overview
- Windroses
- Data Citation
- Data Use Log
- Image Gallery
- Remote Sensing Data
- MODIS
- PhenoCam
- GeoNEX
- Publications
- BADM
| Tower_team: | |
| PI: | Enrique R. Vivoni vivoni@asu.edu - Arizona State University |
| FluxContact: | Eli R. Perez-Ruiz eli.perez@asu.edu - Arizona State University and Universidad Autonoma de Ciudad Juarez |
| Lat, Long: | 31.8173, -110.8508 |
| Elevation(m): | 1169 |
| Network Affiliations: | AmeriFlux |
| Vegetation IGBP: | WSA (Woody Savannas: Lands with herbaceous and other understory systems, and with forest canopy cover between 30-60%. The forest cover height exceeds 2 meters.) |
| Climate Koeppen: | Bsk (Steppe: warm winter) |
| Mean Annual Temp (°C): | 19.4 |
| Mean Annual Precip. (mm): | 388 |
| Flux Species Measured: | CO2, H, H2O |
| Years Data Collected: | 2011 - 2019 |
| Years Data Available: | AmeriFlux BASE 2011 - 2018 Data Citation AmeriFlux FLUXNET 2011 - 2018 Data Citation |
| Data Use Policy: | AmeriFlux CC-BY-4.0 Policy1 |
| Description: | |
| URL: | http://hydrology.asu.edu/wiki/index.php |
| Research Topics: | Watershed hydrology and ecohydrology |
| Acknowledgment: | Funding for the operation and maintenance of the Santa Rita Experimental Range Mesquite Savanna site was provide by the US Army Research Office (grant 56059‐EV‐PCS) and USDA-NIFA (grant 2022-13610-012-06S). |
- This site’s data can also be used under the more restrictive AmeriFlux Legacy Policy.
The AmeriFlux Legacy Policy must be followed if this site’s data are combined with data from sites that require the AmeriFlux Legacy Policy.
Copyright preference: As long as credit is given
US-SRS: Santa Rita Savanna
- Overview
- Windroses
- Data Citation
- Data Use Log
- Image Gallery
- Remote Sensing Data
- MODIS
- PhenoCam
- GeoNEX
- Publications
- BADM
Use the information below for citation of this site. See the Data Policy page for more details.
DOI(s) for citing US-SRS data
Data Use Policy: AmeriFlux CC-BY-4.0 License
This site’s data can also be used under the more restrictive AmeriFlux Legacy Policy.
The AmeriFlux Legacy Policy must be followed if US-SRS data are combined with data from sites that require the AmeriFlux Legacy Policy.
- AmeriFlux BASE: https://doi.org/10.17190/AMF/1660351
Citation: Enrique R. Vivoni, Eli R. Perez-Ruiz (2022), AmeriFlux BASE US-SRS Santa Rita Savanna, Ver. 3-5, AmeriFlux AMP, (Dataset). https://doi.org/10.17190/AMF/1660351 - AmeriFlux FLUXNET: https://doi.org/10.17190/AMF/2204878
Citation: Enrique R. Vivoni, Eli R. Perez-Ruiz (2026), AmeriFlux FLUXNET-1F US-SRS Santa Rita Savanna, Ver. v1.3_r1, AmeriFlux AMP, (Dataset). https://doi.org/10.17190/AMF/2204878
Find global FLUXNET datasets, like FLUXNET2015 and FLUXNET-CH4, and their citation information at fluxnet.org.
To cite BADM when downloaded on their own, use the publications below for citing site characterization. When using BADM that are downloaded with AmeriFlux BASE and AmeriFlux FLUXNET products, use the DOI citation for the associated data product.
Publication(s) for citing site characterization
- —
Acknowledgments
- —
Resources
- AmeriFlux Logos & Acknowledgments
US-SRS: Santa Rita Savanna
- Overview
- Windroses
- Data Citation
- Data Use Log
- Image Gallery
- Remote Sensing Data
- MODIS
- PhenoCam
- GeoNEX
- Publications
- BADM

This page displays the list of downloads of data for the site {{siteId}}.
Note: Results are the number of downloads to distinct data users. The Download Count column indicates the number of times the data user downloaded the data. The Version column refers to the version of the data product for the site that was downloaded by the data user.
| Date | Name | Data Product | Vers. | Intended Use | Intended Use Description | Download Count |
|---|---|---|---|---|---|---|
| {{dlObject.timeStamp}} | {{dlObject.displayName}} | {{displayProduct(dlObject.dataProduct)}} | {{dlObject.version}} | {{dlObject.intendedUse}} | {{dlObject.comment}} | {{dlObject.downloadCounter}} |
Showing {{startItem + 1}} to {{(startItem + items) > filtered.length ? filtered.length : (startItem + items)}} of {{filtered.length}} results
Showing 0 to 0 of 0 results
Not Found
Uh Oh. Something is missing. Try double checking the URL and try again.
US-SRS: Santa Rita Savanna
- Overview
- Windroses
- Data Citation
- Data Use Log
- Image Gallery
- Remote Sensing Data
- MODIS
- PhenoCam
- GeoNEX
- Publications
- BADM
| AmeriFlux Images | Add Image |
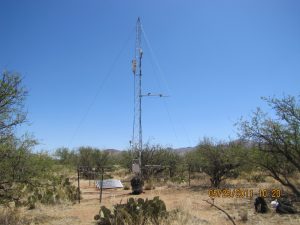
US-SRS Santa Rita Experimental Range Mesquite Savanna
Keywords: —
Location: Arizona, United States
View in Original Size
To download, right-click photo (Mac: control-click) and choose Save Image As
US-SRS: Santa Rita Savanna
- Overview
- Windroses
- Data Citation
- Data Use Log
- Image Gallery
- Remote Sensing Data
- MODIS
- PhenoCam
- GeoNEX
- Publications
- BADM
| AmeriFlux Publications | Add Publication |
| Year | Publication |
|---|---|
| 2022 | Vivoni, E. R., Pérez-Ruiz, E. R., Scott, R. L., Naito, A. T., Archer, S. R., Biederman, J. A., Templeton, N. P. (2022) A Micrometeorological Flux Perspective On Brush Management In A Shrub-Encroached Sonoran Desert Grassland, Agricultural And Forest Meteorology, 313, 108763. https://doi.org/https://doi.org/10.1016/j.agrformet.2021.108763 |
| 2016 | Anderson, C. A., Vivoni, E. R. (2016) Impact Of Land Surface States Within The Flux Footprint On Daytime Land-Atmosphere Coupling In Two Semiarid Ecosystems Of The Southwestern U.S., Water Resources Research, 52(6), 4785-4800. https://doi.org/https://doi.org/10.1002/2015WR018016 |
| 2016 | Mascaro, G., Vivoni, E. R. (2016) On The Observed Hysteresis In Field-Scale Soil Moisture Variability And Its Physical Controls, Environmental Research Letters, 11(8), 084008. https://doi.org/https://doi.org/10.1088/1748-9326/11/8/084008 |
| 2014 | Pierini, N. A., Vivoni, E. R., Robles-Morua, A., Scott, R. L., Nearing, M. A. (2014) Using Observations And A Distributed Hydrologic Model To Explore Runoff Thresholds Linked With Mesquite Encroachment In The Sonoran Desert, Water Resources Research, 50(10), 8191-8215. https://doi.org/https://doi.org/10.1002/2014WR015781 |
US-SRS: Santa Rita Savanna
- Overview
- Windroses
- Data Citation
- Data Use Log
- Image Gallery
- Remote Sensing Data
- MODIS
- PhenoCam
- GeoNEX
- Publications
- BADM
BADM for This Site
Access the Biological, Ancillary, Disturbance and Metadata (BADM) information and data for this site.
BADM contain information for many uses, such as characterizing a site’s vegetation and soil, describing disturbance history, and defining instrumentation for flux processing. They complement the flux/met data.
- Download BADM for this site*
- View Site General Info for this site (Overview tab)*
- Use Online Editor to update Site General Info or DOI Authorship
- Update information about submitted data (Variable Information tool)
- More BADM resources
* Online updates are shown on the Overview tab real time. However, downloaded BADM files will not reflect those updates until they have been reviewed for QA/QC.
US-SRS: Santa Rita Savanna
- Overview
- Windroses
- Data Citation
- Data Use Log
- Image Gallery
- Remote Sensing Data
- MODIS
- PhenoCam
- GeoNEX
- Publications
- BADM
Wind Roses
Wind Speed (m/s)
- Wind Speed Scale: Per Site
- Wind Direction Scale (%): Per Site
- Wind Speed Scale: Non-Linear
- Wind Direction Scale (%): AmeriFlux