
US-Kon: Konza Prairie LTER (KNZ)
- Overview
- Windroses
- Data Citation
- Data Use Log
- Image Gallery
- Remote Sensing Data
- MODIS
- PhenoCam
- GeoNEX
- Publications
- BADM
| Tower_team: | |
| PI: | Nathaniel Brunsell brunsell@ku.edu - Kansas University |
| DataManager: | Bryan Conrad bryan.j.conrad@ku.edu - Kansas University |
| Technician: | Jeff Taylor jht@ksu.edu - Kansas State University |
| Lat, Long: | 39.0824, -96.5603 |
| Elevation(m): | 417 |
| Network Affiliations: | AmeriFlux, Phenocam |
| Vegetation IGBP: | GRA (Grasslands: Lands with herbaceous types of cover. Tree and shrub cover is less than 10%. Permanent wetlands lands with a permanent mixture of water and herbaceous or woody vegetation. The vegetation can be present in either salt, brackish, or fresh water.) |
| Climate Koeppen: | Cfa (Humid Subtropical: mild with no dry season, hot summer) |
| Mean Annual Temp (°C): | 12.77 |
| Mean Annual Precip. (mm): | 867 |
| Flux Species Measured: | CO2, H2O |
| Years Data Collected: | 2006 - Present |
| Years Data Available: | AmeriFlux BASE 2004 - 2019 Data Citation AmeriFlux FLUXNET 2004 - 2019 Data Citation |
| Data Use Policy: | AmeriFlux CC-BY-4.0 Policy1 |
| Description: | Burned on an annual basis. Bison reintroduced in 1987. Experimental cattle herds in 1992 |
| URL: | http://www.konza.ksu.edu |
| Research Topics: | — |
| Acknowledgment: | — |
- This site’s data can also be used under the more restrictive AmeriFlux Legacy Policy.
The AmeriFlux Legacy Policy must be followed if this site’s data are combined with data from sites that require the AmeriFlux Legacy Policy.
Copyright preference: Request for permission
US-Kon: Konza Prairie LTER (KNZ)
- Overview
- Windroses
- Data Citation
- Data Use Log
- Image Gallery
- Remote Sensing Data
- MODIS
- PhenoCam
- GeoNEX
- Publications
- BADM
Use the information below for citation of this site. See the Data Policy page for more details.
DOI(s) for citing US-Kon data
Data Use Policy: AmeriFlux CC-BY-4.0 License
This site’s data can also be used under the more restrictive AmeriFlux Legacy Policy.
The AmeriFlux Legacy Policy must be followed if US-Kon data are combined with data from sites that require the AmeriFlux Legacy Policy.
- AmeriFlux BASE: https://doi.org/10.17190/AMF/1246068
Citation: Nathaniel Brunsell (2020), AmeriFlux BASE US-Kon Konza Prairie LTER (KNZ), Ver. 5-5, AmeriFlux AMP, (Dataset). https://doi.org/10.17190/AMF/1246068 - AmeriFlux FLUXNET: https://doi.org/10.17190/AMF/2316062
Citation: Nathaniel Brunsell (2026), AmeriFlux FLUXNET-1F US-Kon Konza Prairie LTER (KNZ), Ver. v1.3_r1, AmeriFlux AMP, (Dataset). https://doi.org/10.17190/AMF/2316062
Find global FLUXNET datasets, like FLUXNET2015 and FLUXNET-CH4, and their citation information at fluxnet.org.
To cite BADM when downloaded on their own, use the publications below for citing site characterization. When using BADM that are downloaded with AmeriFlux BASE and AmeriFlux FLUXNET products, use the DOI citation for the associated data product.
Publication(s) for citing site characterization
- —
Acknowledgments
- —
Resources
- AmeriFlux Logos & Acknowledgments
US-Kon: Konza Prairie LTER (KNZ)
- Overview
- Windroses
- Data Citation
- Data Use Log
- Image Gallery
- Remote Sensing Data
- MODIS
- PhenoCam
- GeoNEX
- Publications
- BADM

This page displays the list of downloads of data for the site {{siteId}}.
Note: Results are the number of downloads to distinct data users. The Download Count column indicates the number of times the data user downloaded the data. The Version column refers to the version of the data product for the site that was downloaded by the data user.
| Date | Name | Data Product | Vers. | Intended Use | Intended Use Description | Download Count |
|---|---|---|---|---|---|---|
| {{dlObject.timeStamp}} | {{dlObject.displayName}} | {{displayProduct(dlObject.dataProduct)}} | {{dlObject.version}} | {{dlObject.intendedUse}} | {{dlObject.comment}} | {{dlObject.downloadCounter}} |
Showing {{startItem + 1}} to {{(startItem + items) > filtered.length ? filtered.length : (startItem + items)}} of {{filtered.length}} results
Showing 0 to 0 of 0 results
Not Found
Uh Oh. Something is missing. Try double checking the URL and try again.
US-Kon: Konza Prairie LTER (KNZ)
- Overview
- Windroses
- Data Citation
- Data Use Log
- Image Gallery
- Remote Sensing Data
- MODIS
- PhenoCam
- GeoNEX
- Publications
- BADM
| AmeriFlux Images | Add Image |
 US-Kon
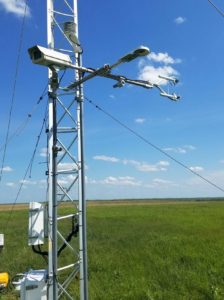
 2013.US.Kon.sitevisit. IMG_8669
2013.US.Kon.sitevisit.IMG_8669
Keywords: —
Location:
View in Original Size
To download, right-click photo (Mac: control-click) and choose Save Image As
 US-Kon
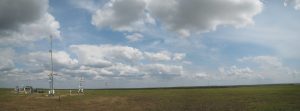
 2013.US.Kon.sitevisit.2013-05-08 2013-05-07 – Panorama Konza – 4
2013.US.Kon.sitevisit.2013-05-08 2013-05-07 - Panorama Konza - 4
Keywords: —
Location:
View in Original Size
To download, right-click photo (Mac: control-click) and choose Save Image As
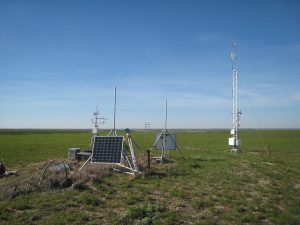
US-Kon 2015.US.Kon.Sitevisit.DSC_0004
2015.US.Kon.Sitevisit.DSC_0004
Keywords: —
Location:
View in Original Size
To download, right-click photo (Mac: control-click) and choose Save Image As
 US-Kon
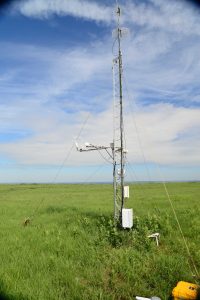
 KON Tower
Photo of the tower which is measuring the high frequency flux data (CO2 and H20), air temperature (sonic and ambient), wind speed (sonic) and incoming and outgoing short and long wave radiation.
Keywords: KON_FLUX
Location: Kansas, United States
View in Original Size
To download, right-click photo (Mac: control-click) and choose Save Image As
US-Kon: Konza Prairie LTER (KNZ)
- Overview
- Windroses
- Data Citation
- Data Use Log
- Image Gallery
- Remote Sensing Data
- MODIS
- PhenoCam
- GeoNEX
- Publications
- BADM
MODIS NDVI
The time series shows the 16-day Normalized Difference Vegetation Index (NDVI) average from the MOD13Q1 data product.
Use the slider below the time series to zoom in and out.
To view / download these data and other MOD13Q1 products for this site, visit MODIS/Terra Vegetation Indices.
For other related products, visit MODIS/VIIRS Fixed Sites Subsets Tool.
Citation:
ORNL DAAC. 2018. Terrestrial Ecology Subsetting & Visualization Services (TESViS) Fixed Sites Subsets. ORNL DAAC, Oak Ridge, Tennessee, USA. https://doi.org/10.3334/ORNLDAAC/1567
MODIS NDVI subsetted data is not yet available for this site.
For a complete list of AmeriFlux sites, visit ORNL DAAC's MODIS/VIIRS Fixed Sites Subsets Tool.


US-Kon: Konza Prairie LTER (KNZ)
- Overview
- Windroses
- Data Citation
- Data Use Log
- Image Gallery
- Remote Sensing Data
- MODIS
- PhenoCam
- GeoNEX
- Publications
- BADM
| AmeriFlux Publications | Add Publication |
| Year | Publication |
|---|---|
| 2025 | Xia, Y., Sanderman, J., Watts, J. D., Machmuller, M. B., Mullen, A. L., Rivard, C., Endsley, A., Hernandez, H., Kimball, J., Ewing, S. A., Litvak, M., Duman, T., Krishnan, P., Meyers, T., Brunsell, N. A., Mohanty, B., Liu, H., Gao, Z., Chen, J., Abraha, M., Scott, R. L., Flerchinger, G. N., Clark, P. E., Stoy, P. C., Khan, A. M., Brookshire, E. N., Zhang, Q., Cook, D. R., Thienelt, T., Mitra, B., Mauritz‐Tozer, M., Tweedie, C. E., Torn, M. S., Billesbach, D. (2025) Coupling Remote Sensing With A Process Model For The Simulation Of Rangeland Carbon Dynamics, Journal Of Advances In Modeling Earth Systems, 17(3), . https://doi.org/10.1029/2024MS004342 |
| 2021 | Chu, H., Luo, X., Ouyang, Z., Chan, W. S., Dengel, S., Biraud, S. C., Torn, M. S., Metzger, S., Kumar, J., Arain, M. A., Arkebauer, T. J., Baldocchi, D., Bernacchi, C., Billesbach, D., Black, T. A., Blanken, P. D., Bohrer, G., Bracho, R., Brown, S., Brunsell, N. A., Chen, J., Chen, X., Clark, K., Desai, A. R., Duman, T., Durden, D., Fares, S., Forbrich, I., Gamon, J. A., Gough, C. M., Griffis, T., Helbig, M., Hollinger, D., Humphreys, E., Ikawa, H., Iwata, H., Ju, Y., Knowles, J. F., Knox, S. H., Kobayashi, H., Kolb, T., Law, B., Lee, X., Litvak, M., Liu, H., Munger, J. W., Noormets, A., Novick, K., Oberbauer, S. F., Oechel, W., Oikawa, P., Papuga, S. A., Pendall, E., Prajapati, P., Prueger, J., Quinton, W. L., Richardson, A. D., Russell, E. S., Scott, R. L., Starr, G., Staebler, R., Stoy, P. C., Stuart-Haëntjens, E., Sonnentag, O., Sullivan, R. C., Suyker, A., Ueyama, M., Vargas, R., Wood, J. D., Zona, D. (2021) Representativeness Of Eddy-Covariance Flux Footprints For Areas Surrounding Ameriflux Sites, Agricultural And Forest Meteorology, 301-302, 108350. https://doi.org/10.1016/j.agrformet.2021.108350 |
| 2016 | Novick, K. A., Ficklin, D. L., Stoy, P. C., Williams, C. A., Bohrer, G., Oishi, A., Papuga, S. A., Blanken, P. D., Noormets, A., Sulman, B. N., Scott, R. L., Wang, L., Phillips, R. P. (2016) The Increasing Importance Of Atmospheric Demand For Ecosystem Water And Carbon Fluxes, Nature Climate Change, 6(11), 1023-1027. https://doi.org/10.1038/nclimate3114 |
| 2001 | Antunes, M. A. H., Walter-Shea, E. A., Mesarch, M. A. (2001) Test Of An Extended Mathematical Approach To Calculate Maize Leaf Area Index And Leaf Angle Distribution, Agricultural And Forest Meteorology, 108(1), 45-53. https://doi.org/10.1016/s0168-1923(01)00219-2 |
| 2003 | Danner, B. T., Knapp, A. K. (2003) Abiotic Constraints On The Establishment Of Quercus Seedlings In Grassland, Global Change Biology, 9(2), 266-275. https://doi.org/10.1046/j.1365-2486.2003.00574.x |
| 1999 | Turner, D. P., Cohen, W. B., Kennedy, R. E., Fassnacht, K. S., Briggs, J. M. (1999) Relationships Between Leaf Area Index And Landsat TM Spectral Vegetation Indices Across Three Temperate Zone Sites, Remote Sensing Of Environment, 70(1), 52-68. https://doi.org/10.1016/s0034-4257(99)00057-7 |
| 1999 | Smith, M. D., Hartnett, D. C., Wilson, G. W. (1999) Interacting Influence Of Mycorrhizal Symbiosis And Competition On Plant Diversity In Tallgrass Prairie, Oecologia, 121(4), 574-582. https://doi.org/10.1007/s004420050964 |
| 1999 | Reich, P. B., Turner, D. P., Bolstad, P. (1999) An Approach To Spatially Distributed Modeling Of Net Primary Production (NPP) At The Landscape Scale And Its Application In Validation Of EOS NPP Products, Remote Sensing Of Environment, 70(1), 69-81. https://doi.org/10.1016/s0034-4257(99)00058-9 |
| 2003 | Turner, D. P., Urbanski, S., Bremer, D., Wofsy, S. C., Meyers, T., Gower, S. T., Gregory, M. (2003) A Cross-Biome Comparison Of Daily Light Use Efficiency For Gross Primary Production, Global Change Biology, 9(3), 383-395. https://doi.org/10.1046/j.1365-2486.2003.00573.x |
| 2002 | Scurlock, J. M., Johnson, K., Olson, R. J. (2002) Estimating Net Primary Productivity From Grassland Biomass Dynamics Measurements, Global Change Biology, 8(8), 736-753. https://doi.org/10.1046/j.1365-2486.2002.00512.x |
| 1999 | Bremer, D. J., Ham, J. M. (1999) Effect Of Spring Burning On The Surface Energy Balance In A Tallgrass Prairie, Agricultural And Forest Meteorology, 97(1), 43-54. https://doi.org/10.1016/s0168-1923(99)00034-9 |
| 2016 | Wolf, S., Keenan, T.F., Fisher, J.B., Baldocchi, D.D., Desai, A.R., Richardson, A.D., Scott, R.L., Law, B.E., Litvak, M.E., Brunsell, N.A., Peters, W., van der Laan-Luijkx, I.T. (2016) Warm spring reduced carbon cycle impact of the 2012 US summer drought, Proceedings of the National Academy of Sciences, 113(21), 5880-5885. https://doi.org/10.1073/pnas.1519620113 |
US-Kon: Konza Prairie LTER (KNZ)
- Overview
- Windroses
- Data Citation
- Data Use Log
- Image Gallery
- Remote Sensing Data
- MODIS
- PhenoCam
- GeoNEX
- Publications
- BADM
BADM for This Site
Access the Biological, Ancillary, Disturbance and Metadata (BADM) information and data for this site.
BADM contain information for many uses, such as characterizing a site’s vegetation and soil, describing disturbance history, and defining instrumentation for flux processing. They complement the flux/met data.
- Download BADM for this site*
- View Site General Info for this site (Overview tab)*
- Use Online Editor to update Site General Info or DOI Authorship
- Update information about submitted data (Variable Information tool)
- More BADM resources
* Online updates are shown on the Overview tab real time. However, downloaded BADM files will not reflect those updates until they have been reviewed for QA/QC.
US-Kon: Konza Prairie LTER (KNZ)
- Overview
- Windroses
- Data Citation
- Data Use Log
- Image Gallery
- Remote Sensing Data
- MODIS
- PhenoCam
- GeoNEX
- Publications
- BADM
Wind Roses
Wind Speed (m/s)
- Wind Speed Scale: Per Site
- Wind Direction Scale (%): Per Site
- Wind Speed Scale: Non-Linear
- Wind Direction Scale (%): AmeriFlux