US-GL1: Stannard Rock
- Overview
- Windroses
- Data Citation
- Data Use Log
- Image Gallery
- Remote Sensing Data
- MODIS
- PhenoCam
- GeoNEX
- Publications
- BADM
Tower_team: | |
DataManager: | Erin Nicholls erin.nicholls@ucalgary.ca - University of Calgary |
PI: | Chris Spence chris.spence@ec.gc.ca - Environment and Climate Change Canada |
Lat, Long: | 47.1835, -87.2251 |
Elevation(m): | 183 |
Network Affiliations: | AmeriFlux |
Vegetation IGBP: | WAT (Water Bodies : Oceans, seas, lakes, reservoirs, and rivers. Can be either fresh or salt- water bodies.) |
Climate Koeppen: | Dfb (Warm Summer Continental: significant precipitation in all seasons ) |
Mean Annual Temp (°C): | 5.4 |
Mean Annual Precip. (mm): | — |
Flux Species Measured: | CO2, H, H2O |
Years Data Collected: | 2008 - Present |
Years Data Available: | AmeriFlux BASE 2008 - 2022 Data Citation |
Data Use Policy: | AmeriFlux CC-BY-4.0 Policy1 |
Description: | Stannard Rock is located 39 km from the nearest shore (Keweenaw Peninsula) in Lake Superior, 44 miles NNE of Marquette, Michigan, and 24 miles ESE of Manitou ... Stannard Rock is located 39 km from the nearest shore (Keweenaw Peninsula) in Lake Superior, 44 miles NNE of Marquette, Michigan, and 24 miles ESE of Manitou Island. The site is located on the historic Stannard Rock Lighthouse, which was completed in 1882. Eddy covariance instrumentation was installed in 2008 by a network of scientists from both US and Canada, eventually to be called the Great Lakes Evaporation Network (GLEN). The intent of GLEN has been to provide observations of over-lake meteorology and evaporation, improve forecasting of Great Lakes water levels, and support a wide variety of stakeholders, including the National Weather Service (NWS), Environment and Climate Change Canada, National Oceanic and Atmospheric Administration, U.S. Coast Guard, recreational boaters and commercial shipping, emergency management officials, and the Great Lakes research community. The eddy covariance station along with other ancillary meteorological instrumentation is located at an approximate elevation of 39.2 meters above mean lake water level. Meteorological data from the lighthouse are sent to the National Data Buoy Center, where they can be viewed in real-time at http://www.ndbc.noaa.gov/station_page.php?station=stdm4
Uncorrected half-hour fluxes were computed directly on the logger using a 30-minute block averaging period as high-frequency data were not available. The half hour flux measurements downloaded from the datalogger were post-processed with the following filters and corrections. Latent and sensible heat and carbon dioxide fluxes were corrected with 2-D coordinate rotation. Although the primary objective of data collection at Stannard Rock was to quantify the evaporative flux, additional preliminary measurements of the carbon dioxide concentration and flux from the LI-7500 are also included in this dataset but it is advised to use the carbon data with caution. Carbon data reported in this dataset includes turbulent fluxes of CO2 with no storage correction (FC, µmol m-2 s-1) and CO2 density in mole fraction of wet air (CO2), which was originally output on the datalogger as average CO2 density (mg m-2 s-1) and converted into µmol mol-1 using air temperature and pressure in post-processing. Webb, Pearman, and Leuning terms were applied to account for density fluctuations for water vapor and CO2. Sonic path length, high-frequency attenuation and sensor separation were accounted for according to Horst and Massman, and the oxygen absorption correction for the KH2O hygrometer was also applied. Latent and sensible heat fluxes were assumed to be unrealistic above an absolute value of 1000 W m-2 and were removed. Both carbon flux (FC) and carbon dioxide mole fraction in wet air (CO2) and were assumed to be unrealistic above 1000 µmol m-2 s-1 and 1000 µmol mol-1 respectively. Spikes in latent and sensible heat and carbon fluxes and densities (often due to periods of precipitation) were identified by computing the mean and standard deviation over a moving, overlapping window of 336 half-hours (7 days), similar to Shao et al., and were removed when the flux was more than 1.5 standard deviations from the moving window’s mean. While Vickers and Mahrt use a threshold of 3.5 standard deviations from the mean, a conservative value of 1.5 was chosen due to the noisy nature of over-lake data at this particular site. This process was repeated twice for latent and sensible heat, and carbon dioxide fluxes and densities and therefore it is possible that some real, realistic data was filtered out in this process. No detrending was performed. As per AmeriFlux standards, no friction velocity (USTAR, m s-1) filtering was performed. See MoreShow Less |
URL: | https://superiorwatersheds.org/GLEN/data.htm |
Research Topics: | Over-lake meteorology and evaporation to forecast Great Lakes water levels |
Acknowledgment: | Stannard Rock Lighthouse Eddy Covariance Station has been supported by Environment and Climate Change Canada (ECCC), National Oceanic and Atmospheric Administration, International Joint Commission - International Upper Great Lakes Study, Michigan Tech, University of Colorado, University of Michigan, Great Lakes Observing System, and the National Science Foundation. The site has been continuously operational thanks to Newell Hedstrom and Christopher Spence (ECCC), Peter Blanken (University of Colorado), and John Lenters (Michigan Tech). |
- This site’s data can also be used under the more restrictive AmeriFlux Legacy Policy.
The AmeriFlux Legacy Policy must be followed if this site’s data are combined with data from sites that require the AmeriFlux Legacy Policy.


Copyright preference: As long as credit is given
US-GL1: Stannard Rock
- Overview
- Windroses
- Data Citation
- Data Use Log
- Image Gallery
- Remote Sensing Data
- MODIS
- PhenoCam
- GeoNEX
- Publications
- BADM
Use the information below for citation of this site. See the Data Policy page for more details.
DOI(s) for citing US-GL1 data
Data Use Policy: AmeriFlux CC-BY-4.0 License
This site’s data can also be used under the more restrictive AmeriFlux Legacy Policy.
The AmeriFlux Legacy Policy must be followed if US-GL1 data are combined with data from sites that require the AmeriFlux Legacy Policy.
- AmeriFlux BASE: https://doi.org/10.17190/AMF/2204057
Citation: Chris Spence (2024), AmeriFlux BASE US-GL1 Stannard Rock, Ver. 3-5, AmeriFlux AMP, (Dataset). https://doi.org/10.17190/AMF/2204057
To cite BADM when downloaded on their own, use the publications below for citing site characterization. When using BADM that are downloaded with AmeriFlux BASE and AmeriFlux FLUXNET products, use the DOI citation for the associated data product.
Publication(s) for citing site characterization
- —
Acknowledgments
- —
Resources
- AmeriFlux Logos & Acknowledgments
US-GL1: Stannard Rock
- Overview
- Windroses
- Data Citation
- Data Use Log
- Image Gallery
- Remote Sensing Data
- MODIS
- PhenoCam
- GeoNEX
- Publications
- BADM

This page displays the list of downloads of data for the site US-GL1.
Note: Results are the number of downloads to distinct data users. The Download Count column indicates the number of times the data user downloaded the data. The Version column refers to the version of the data product for the site that was downloaded by the data user.
Date | Name | Data Product | Version | Intended Use | Intended Use Description | Download Count |
---|
Date | Name | Data Product | Vers. | Intended Use | Intended Use Description | Download Count |
---|---|---|---|---|---|---|
Showing 0 to 0 of 0 results
Not Found
Uh Oh. Something is missing. Try double checking the URL and try again.
US-GL1: Stannard Rock
- Overview
- Windroses
- Data Citation
- Data Use Log
- Image Gallery
- Remote Sensing Data
- MODIS
- PhenoCam
- GeoNEX
- Publications
- BADM
AmeriFlux Images | Add Image |
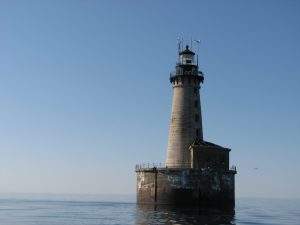
Stannard Rock Lighthouse – US-GL1
Eddy covariance instrumentation atop Stannard Rock Lighthouse, Lake Superior
Keywords: Lake Superior, Stannard Rock
Location: Michigan, United States
View in Original Size
To download, right-click photo (Mac: control-click) and choose Save Image As
US-GL1: Stannard Rock
- Overview
- Windroses
- Data Citation
- Data Use Log
- Image Gallery
- Remote Sensing Data
- MODIS
- PhenoCam
- GeoNEX
- Publications
- BADM
MODIS NDVI
The time series shows the 16-day Normalized Difference Vegetation Index (NDVI) average from the MOD13Q1 data product.
Use the slider below the time series to zoom in and out.
To view / download these data and other MOD13Q1 products for this site, visit MODIS/Terra Vegetation Indices.
For other related products, visit MODIS/VIIRS Fixed Sites Subsets Tool.
Citation:
ORNL DAAC. 2018. Terrestrial Ecology Subsetting & Visualization Services (TESViS) Fixed Sites Subsets. ORNL DAAC, Oak Ridge, Tennessee, USA. https://doi.org/10.3334/ORNLDAAC/1567
MODIS NDVI subsetted data is not yet available for this site.
For a complete list of AmeriFlux sites, visit ORNL DAAC's MODIS/VIIRS Fixed Sites Subsets Tool.
PhenoCam Images and Derived Time Series Data
PhenoCams are high-resolution digital cameras that take repeated images of studied ecosystems and provide quantitative information about the canopy phenology. The PhenoCam Network coordinates the camera installation and data reporting/analyses across sites in the Americas, providing automated, near-surface remote sensing of canopy phenology across a range of ecosystems and climate zones. Use of PhenoCam images / data should follow the PhenoCam Data Use Policy .
No PhenoCam data for this siteGeoNEX Data Products
GeoNEX led by NASA Earth eXchange (NEX) is a collaborative effort for generating Earth monitoring products from the new generation of geostationary satellite sensors. GeoNEX has produced a suite of geostationary data products including surface reflectance, land surface temperature, surface solar radiation, and many others.
The GeoNEX Common Grid locates GeoNEX data in the geographic (latitude/longitude) projection. Pixels (grid cells) are created at regular 0.005°, 0.01°, and 0.02° resolutions.
GeoNEX pixels below cover the area 0.06° x 0.06° around and including site US-GL1, 47.1835, -87.2251.
Click a square in the grid at left to display its data below.
Coordinates for selected GeoNEX Pixel
Graph controls:
- Zoom: click-drag
- Pan: shift-click-drag
- Restore zoom level: double-click
- Use the slider below the time series to zoom in and out.
All download requests will be logged.
NDVI: Normalized Difference Vegetation Index
Resolution: 0.01° x 0.01° & 10 minutes
Coordinates for pixel:
NIRv Near-Infrared Reflectance of vegetation
Resolution: 0.01° x 0.01° & 10 minutes
Coordinates for pixel:
DSR: Surface downward shortwave radiation
Resolution: 0.01° x 0.01° & Hourly
Coordinates for pixel:
LST: Land Surface Temperature
Resolution: 0.02° x 0.02° & Hourly
Coordinates for pixel:
Citation
This material can be used without obtaining permission from NASA. NASA should be acknowledged as the source of this material.
Subset Data Citation:
- Hashimoto, H., Wang, W., Park, T., Khajehei, S., Ichii, K., Michaelis, A.R., Guzman, A., Nemani, R.R., Torn, M., Yi, K., Brosnan, I.G. (in preparation). Subsets of geostationary satellite data over international observing network sites for studying the diurnal dynamics of energy, carbon, and water cycles.
Relevant Science Publication Citation:
GeoNEX Surface Reflectance for Vegetation Indices (NDVI & NIRv)- Wang, W., Wang, Y., Lyapustin, A., Hashimoto, H., Park, T., Michaelis, A., & Nemani, R. (2022). A novel atmospheric correction algorithm to exploit the diurnal variability in hypertemporal geostationary observations. Remote Sensing, 14(4), 964.
- Li, R., Wang, D., Wang, W., & Nemani, R. (2023). A GeoNEX-based high-spatiotemporal-resolution product of land surface downward shortwave radiation and photosynthetically active radiation. Earth System Science Data, 15(3), 1419-1436.
- Jia, A., Liang, S., & Wang, D. (2022). Generating a 2-km, all-sky, hourly land surface temperature product from Advanced Baseline Imager data. Remote Sensing of Environment, 278, 113105.
US-GL1: Stannard Rock
- Overview
- Windroses
- Data Citation
- Data Use Log
- Image Gallery
- Remote Sensing Data
- MODIS
- PhenoCam
- GeoNEX
- Publications
- BADM
AmeriFlux Publications | Add Publication |
Year | Publication |
---|---|
2011 | Spence, C., Blanken, P., Hedstrom, N., Fortin, V., Wilson, H. (2011) Evaporation From Lake Superior: 2 Spatial distribution and variability, Journal Of Great Lakes Research, 37(4), 717-724. https://doi.org/10.1016/j.jglr.2011.08.013 |
2011 | (2011) Evaporation from Lake Superior: 1. Physical controls and processes, Journal of Great Lakes Research, 37(4), 707-716. https://doi.org/10.1016/j.jglr.2011.08.009 |
US-GL1: Stannard Rock
- Overview
- Windroses
- Data Citation
- Data Use Log
- Image Gallery
- Remote Sensing Data
- MODIS
- PhenoCam
- GeoNEX
- Publications
- BADM
BADM for This Site
Access the Biological, Ancillary, Disturbance and Metadata (BADM) information and data for this site.
BADM contain information for many uses, such as characterizing a site’s vegetation and soil, describing disturbance history, and defining instrumentation for flux processing. They complement the flux/met data.
- Download BADM for this site*
- View Site General Info for this site (Overview tab)*
- Use Online Editor to update Site General Info or DOI Authorship
- Update information about submitted data (Variable Information tool)
- More BADM resources
* Online updates are shown on the Overview tab real time. However, downloaded BADM files will not reflect those updates until they have been reviewed for QA/QC.
US-GL1: Stannard Rock
- Overview
- Windroses
- Data Citation
- Data Use Log
- Image Gallery
- Remote Sensing Data
- MODIS
- PhenoCam
- GeoNEX
- Publications
- BADM