
US-Br1: Brooks Field Site 10- Ames
- Overview
- Windroses
- Data Citation
- Data Use Log
- Image Gallery
- Remote Sensing Data
- MODIS
- PhenoCam
- GeoNEX
- Publications
- BADM
| Tower_team: | |
| PI: | John Prueger john.prueger@ars.usda.gov - National Laboratory for Agriculture and the Environment |
| DataManager: | Samantha Purdy samantha.purdy@usda.gov - National Laboratory for Agriculture and the Environment |
| Lat, Long: | 41.9749, -93.6906 |
| Elevation(m): | 313 |
| Network Affiliations: | AmeriFlux, Phenocam |
| Vegetation IGBP: | CRO (Croplands: Lands covered with temporary crops followed by harvest and a bare soil period (e.g., single and multiple cropping systems). Note that perennial woody crops will be classified as the appropriate forest or shrub land cover type.) |
| Climate Koeppen: | Dfa (Humid Continental: humid with severe winter, no dry season, hot summer) |
| Mean Annual Temp (°C): | 8.95 |
| Mean Annual Precip. (mm): | 842.33 |
| Flux Species Measured: | CO2 |
| Years Data Collected: | 2001 - 2025 |
| Years Data Available: | AmeriFlux BASE 2005 - 2011 Data Citation |
| Data Use Policy: | AmeriFlux Legacy Policy |
| Description: | |
| URL: | — |
| Research Topics: | |
| Acknowledgment: | — |
Copyright preference: Request for permission
US-Br1: Brooks Field Site 10- Ames
- Overview
- Windroses
- Data Citation
- Data Use Log
- Image Gallery
- Remote Sensing Data
- MODIS
- PhenoCam
- GeoNEX
- Publications
- BADM
Use the information below for citation of this site. See the Data Policy page for more details.
DOI(s) for citing US-Br1 data
Data Use Policy: AmeriFlux Legacy Policy
- AmeriFlux BASE: https://doi.org/10.17190/AMF/1246038
Citation: John Prueger, Tim Parkin (2016), AmeriFlux BASE US-Br1 Brooks Field Site 10- Ames, Ver. 1-1, AmeriFlux AMP, (Dataset). https://doi.org/10.17190/AMF/1246038
To cite BADM when downloaded on their own, use the publications below for citing site characterization. When using BADM that are downloaded with AmeriFlux BASE and AmeriFlux FLUXNET products, use the DOI citation for the associated data product.
Publication(s) for citing site characterization
- —
Acknowledgments
- —
Resources
- AmeriFlux Logos & Acknowledgments
US-Br1: Brooks Field Site 10- Ames
- Overview
- Windroses
- Data Citation
- Data Use Log
- Image Gallery
- Remote Sensing Data
- MODIS
- PhenoCam
- GeoNEX
- Publications
- BADM

This page displays the list of downloads of data for the site {{siteId}}.
Note: Results are the number of downloads to distinct data users. The Download Count column indicates the number of times the data user downloaded the data. The Version column refers to the version of the data product for the site that was downloaded by the data user.
| Date | Name | Data Product | Vers. | Intended Use | Intended Use Description | Download Count |
|---|---|---|---|---|---|---|
| {{dlObject.timeStamp}} | {{dlObject.displayName}} | {{displayProduct(dlObject.dataProduct)}} | {{dlObject.version}} | {{dlObject.intendedUse}} | {{dlObject.comment}} | {{dlObject.downloadCounter}} |
Showing {{startItem + 1}} to {{(startItem + items) > filtered.length ? filtered.length : (startItem + items)}} of {{filtered.length}} results
Showing 0 to 0 of 0 results
Not Found
Uh Oh. Something is missing. Try double checking the URL and try again.
US-Br1: Brooks Field Site 10- Ames
- Overview
- Windroses
- Data Citation
- Data Use Log
- Image Gallery
- Remote Sensing Data
- MODIS
- PhenoCam
- GeoNEX
- Publications
- BADM
| AmeriFlux Images | Add Image |
 US-Br1
 2005.US.Br1.sitevisit.IMG_0567
2005.US.Br1.sitevisit.IMG_0567
Keywords: —
Location:
View in Original Size
To download, right-click photo (Mac: control-click) and choose Save Image As
 US-Br1
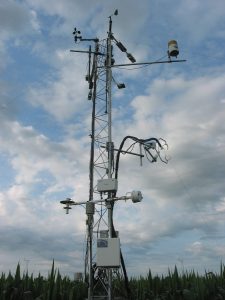
 2009.US.Br1.Sitevisit.P7232849
2009.US.Br1.Sitevisit.P7232849
Keywords: —
Location:
View in Original Size
To download, right-click photo (Mac: control-click) and choose Save Image As
 US-Br1
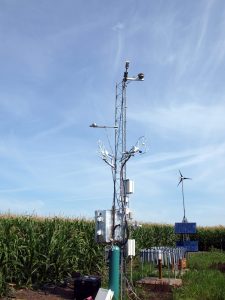
 2009.US.Br1.Sitevisit.P7232857
2009.US.Br1.Sitevisit.P7232857
Keywords: —
Location:
View in Original Size
To download, right-click photo (Mac: control-click) and choose Save Image As
 US-Br1
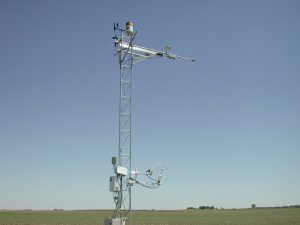
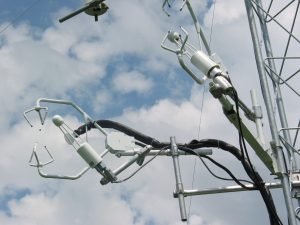
 Corn Ames, IA Site Equipment
2005 Corn Ames, IA Site visit picture.
Keywords: Amerflux
Location: United States
View in Original Size
To download, right-click photo (Mac: control-click) and choose Save Image As
 US-Br1
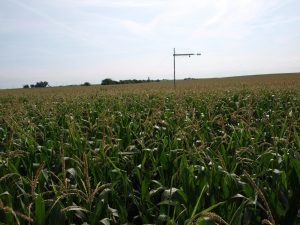
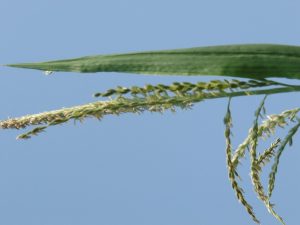
 Corn Ames, IA Site Field
2005 Corn Ames, IA Site visit picture.
Keywords: —
Location: United States
View in Original Size
To download, right-click photo (Mac: control-click) and choose Save Image As
 US-Br1
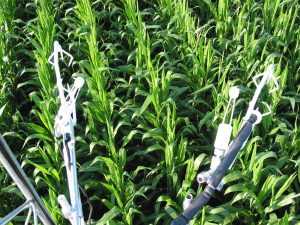
 Corn Ames, IA Site Field
2005 Corn Ames, IA Site visit picture.
Keywords: Amerflux
Location: United States
View in Original Size
To download, right-click photo (Mac: control-click) and choose Save Image As
US-Br1 Corn Tipping Buc
2005 Corn Ames, IA Site visit picture.
Keywords: Amerflux
Location: United States
View in Original Size
To download, right-click photo (Mac: control-click) and choose Save Image As
US-Br1: Brooks Field Site 10- Ames
- Overview
- Windroses
- Data Citation
- Data Use Log
- Image Gallery
- Remote Sensing Data
- MODIS
- PhenoCam
- GeoNEX
- Publications
- BADM
MODIS NDVI
The time series shows the 16-day Normalized Difference Vegetation Index (NDVI) average from the MOD13Q1 data product.
Use the slider below the time series to zoom in and out.
To view / download these data and other MOD13Q1 products for this site, visit MODIS/Terra Vegetation Indices.
For other related products, visit MODIS/VIIRS Fixed Sites Subsets Tool.
Citation:
ORNL DAAC. 2018. Terrestrial Ecology Subsetting & Visualization Services (TESViS) Fixed Sites Subsets. ORNL DAAC, Oak Ridge, Tennessee, USA. https://doi.org/10.3334/ORNLDAAC/1567
MODIS NDVI subsetted data is not yet available for this site.
For a complete list of AmeriFlux sites, visit ORNL DAAC's MODIS/VIIRS Fixed Sites Subsets Tool.


US-Br1: Brooks Field Site 10- Ames
- Overview
- Windroses
- Data Citation
- Data Use Log
- Image Gallery
- Remote Sensing Data
- MODIS
- PhenoCam
- GeoNEX
- Publications
- BADM
| AmeriFlux Publications | Add Publication |
| Year | Publication |
|---|---|
| 2018 | Chu, H., Baldocchi, D. D., Poindexter, C., Abraha, M., Desai, A. R., Bohrer, G., Arain, M. A., Griffis, T., Blanken, P. D., O'Halloran, T. L., Thomas, R. Q., Zhang, Q., Burns, S. P., Frank, J. M., Christian, D., Brown, S., Black, T. A., Gough, C. M., Law, B. E., Lee, X., Chen, J., Reed, D. E., Massman, W. J., Clark, K., Hatfield, J., Prueger, J., Bracho, R., Baker, J. M., Martin, T. A. (2018) Temporal Dynamics Of Aerodynamic Canopy Height Derived From Eddy Covariance Momentum Flux Data Across North American Flux Networks, Geophysical Research Letters, 45, 9275–9287. https://doi.org/10.1029/2018GL079306 |
US-Br1: Brooks Field Site 10- Ames
- Overview
- Windroses
- Data Citation
- Data Use Log
- Image Gallery
- Remote Sensing Data
- MODIS
- PhenoCam
- GeoNEX
- Publications
- BADM
BADM for This Site
Access the Biological, Ancillary, Disturbance and Metadata (BADM) information and data for this site.
BADM contain information for many uses, such as characterizing a site’s vegetation and soil, describing disturbance history, and defining instrumentation for flux processing. They complement the flux/met data.
- Download BADM for this site*
- View Site General Info for this site (Overview tab)*
- Use Online Editor to update Site General Info or DOI Authorship
- Update information about submitted data (Variable Information tool)
- More BADM resources
* Online updates are shown on the Overview tab real time. However, downloaded BADM files will not reflect those updates until they have been reviewed for QA/QC.
US-Br1: Brooks Field Site 10- Ames
- Overview
- Windroses
- Data Citation
- Data Use Log
- Image Gallery
- Remote Sensing Data
- MODIS
- PhenoCam
- GeoNEX
- Publications
- BADM
Wind Roses
Wind Speed (m/s)
- Wind Speed Scale: Per Site
- Wind Direction Scale (%): Per Site
- Wind Speed Scale: Non-Linear
- Wind Direction Scale (%): AmeriFlux