
US-Bar: Bartlett Experimental Forest
- Overview
- Windroses
- Data Citation
- Data Use Log
- Image Gallery
- Remote Sensing Data
- MODIS
- PhenoCam
- GeoNEX
- Publications
- BADM
| Tower_team: | |
| PI: | Andrew Richardson Andrew.Richardson@nau.edu - Northern Arizona University |
| FluxContact: | David Hollinger dyhollinger@gmail.com - USDA Forest Service |
| Technician: | Andrew Ouimette apouimette@gmail.com - USDA Forest Service |
| Lat, Long: | 44.0646, -71.2881 |
| Elevation(m): | 272 |
| Network Affiliations: | AmeriFlux, Phenocam |
| Vegetation IGBP: | DBF (Deciduous Broadleaf Forests: Lands dominated by woody vegetation with a percent cover >60% and height exceeding 2 meters. Consists of broadleaf tree communities with an annual cycle of leaf-on and leaf-off periods.) |
| Climate Koeppen: | Dfb (Warm Summer Continental: significant precipitation in all seasons ) |
| Mean Annual Temp (°C): | 5.61 |
| Mean Annual Precip. (mm): | 1245.77 |
| Flux Species Measured: | CO2, H, H2O |
| Years Data Collected: | 2004 - Present |
| Years Data Available: | AmeriFlux BASE 2004 - 2024 Data Citation AmeriFlux FLUXNET 2004 - 2023 Data Citation |
| Data Use Policy: | AmeriFlux CC-BY-4.0 Policy1 |
| Description: | |
| URL: | http://www.fs.fed.us/ne/durham/4155/bartlett.htm |
| Research Topics: | — |
| Acknowledgment: | Research at the Bartlett Experimental Forest tower is supported by the USDA Forest Service's Northern Research Station and the National Science Foundation (grant DEB-1114804). |
- This site’s data can also be used under the more restrictive AmeriFlux Legacy Policy.
The AmeriFlux Legacy Policy must be followed if this site’s data are combined with data from sites that require the AmeriFlux Legacy Policy.
Copyright preference: Request for permission
US-Bar: Bartlett Experimental Forest
- Overview
- Windroses
- Data Citation
- Data Use Log
- Image Gallery
- Remote Sensing Data
- MODIS
- PhenoCam
- GeoNEX
- Publications
- BADM
Use the information below for citation of this site. See the Data Policy page for more details.
DOI(s) for citing US-Bar data
Data Use Policy: AmeriFlux CC-BY-4.0 License
This site’s data can also be used under the more restrictive AmeriFlux Legacy Policy.
The AmeriFlux Legacy Policy must be followed if US-Bar data are combined with data from sites that require the AmeriFlux Legacy Policy.
- AmeriFlux BASE: https://doi.org/10.17190/AMF/1246030
Citation: Andrew Richardson, David Hollinger (2025), AmeriFlux BASE US-Bar Bartlett Experimental Forest, Ver. 7-5, AmeriFlux AMP, (Dataset). https://doi.org/10.17190/AMF/1246030 - AmeriFlux FLUXNET: https://doi.org/10.17190/AMF/2006969
Citation: Andrew Richardson, David Hollinger (2025), AmeriFlux FLUXNET-1F US-Bar Bartlett Experimental Forest, Ver. 5-7, AmeriFlux AMP, (Dataset). https://doi.org/10.17190/AMF/2006969
Find global FLUXNET datasets, like FLUXNET2015 and FLUXNET-CH4, and their citation information at fluxnet.org.
To cite BADM when downloaded on their own, use the publications below for citing site characterization. When using BADM that are downloaded with AmeriFlux BASE and AmeriFlux FLUXNET products, use the DOI citation for the associated data product.
Publication(s) for citing site characterization
- —
Acknowledgments
- —
Resources
- AmeriFlux Logos & Acknowledgments
US-Bar: Bartlett Experimental Forest
- Overview
- Windroses
- Data Citation
- Data Use Log
- Image Gallery
- Remote Sensing Data
- MODIS
- PhenoCam
- GeoNEX
- Publications
- BADM

This page displays the list of downloads of data for the site {{siteId}}.
Note: Results are the number of downloads to distinct data users. The Download Count column indicates the number of times the data user downloaded the data. The Version column refers to the version of the data product for the site that was downloaded by the data user.
| Date | Name | Data Product | Vers. | Intended Use | Intended Use Description | Download Count |
|---|---|---|---|---|---|---|
| {{dlObject.timeStamp}} | {{dlObject.displayName}} | {{displayProduct(dlObject.dataProduct)}} | {{dlObject.version}} | {{dlObject.intendedUse}} | {{dlObject.comment}} | {{dlObject.downloadCounter}} |
Showing {{startItem + 1}} to {{(startItem + items) > filtered.length ? filtered.length : (startItem + items)}} of {{filtered.length}} results
Showing 0 to 0 of 0 results
Not Found
Uh Oh. Something is missing. Try double checking the URL and try again.
US-Bar: Bartlett Experimental Forest
- Overview
- Windroses
- Data Citation
- Data Use Log
- Image Gallery
- Remote Sensing Data
- MODIS
- PhenoCam
- GeoNEX
- Publications
- BADM
| AmeriFlux Images | Add Image |
 US-Bar
 US-Bar: Bartlett Experimental Forest
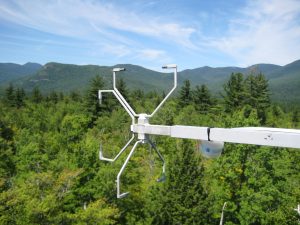
US-Bar: Eddy flux tower
Keywords: —
Location: New Hampshire, United States
View in Original Size
To download, right-click photo (Mac: control-click) and choose Save Image As
 US-Bar
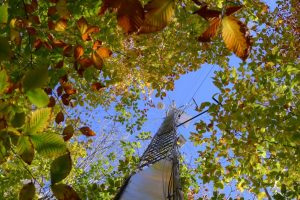
 US-Bar Eddy flux tower
US-Bar tower seen from the NEON tower PhenoCam (https://phenocam.nau.edu/webcam/sites/bartlettir/)
Keywords: —
Location: New Hampshire, United States
View in Original Size
To download, right-click photo (Mac: control-click) and choose Save Image As
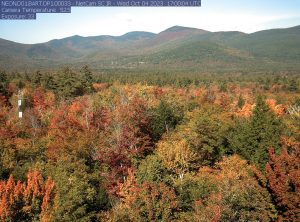
US-Bar 2016.US.Bar.Sitevisit.IMG_7118
2016.US.Bar.Sitevisit.IMG_7118
Keywords: —
Location:
View in Original Size
To download, right-click photo (Mac: control-click) and choose Save Image As
US-Bar: Bartlett Experimental Forest
- Overview
- Windroses
- Data Citation
- Data Use Log
- Image Gallery
- Remote Sensing Data
- MODIS
- PhenoCam
- GeoNEX
- Publications
- BADM
MODIS NDVI
The time series shows the 16-day Normalized Difference Vegetation Index (NDVI) average from the MOD13Q1 data product.
Use the slider below the time series to zoom in and out.
To view / download these data and other MOD13Q1 products for this site, visit MODIS/Terra Vegetation Indices.
For other related products, visit MODIS/VIIRS Fixed Sites Subsets Tool.
Citation:
ORNL DAAC. 2018. Terrestrial Ecology Subsetting & Visualization Services (TESViS) Fixed Sites Subsets. ORNL DAAC, Oak Ridge, Tennessee, USA. https://doi.org/10.3334/ORNLDAAC/1567
MODIS NDVI subsetted data is not yet available for this site.
For a complete list of AmeriFlux sites, visit ORNL DAAC's MODIS/VIIRS Fixed Sites Subsets Tool.


US-Bar: Bartlett Experimental Forest
- Overview
- Windroses
- Data Citation
- Data Use Log
- Image Gallery
- Remote Sensing Data
- MODIS
- PhenoCam
- GeoNEX
- Publications
- BADM
| AmeriFlux Publications | Add Publication |
| Year | Publication |
|---|---|
| 2025 | Liu, Y., Lucas, B., Bergl, D. D., Richardson, A. D. (2025) Robust Filling Of Extra-Long Gaps In Eddy Covariance Co2 Flux Measurements From A Temperate Deciduous Forest Using Extreme Gradient Boosting, Agricultural And Forest Meteorology, 364, 110438. https://doi.org/https://doi.org/10.1016/j.agrformet.2025.110438 |
| 2022 | Teets, A., Moore, D. J., Alexander, M. R., Blanken, P. D., Bohrer, G., Burns, S. P., Carbone, M. S., Ducey, M. J., Fraver, S., Gough, C. M., Hollinger, D. Y., Koch, G., Kolb, T., Munger, J. W., Novick, K. A., Ollinger, S. V., Ouimette, A. P., Pederson, N., Ricciuto, D. M., Seyednasrollah, B., Vogel, C. S., Richardson, A. D. (2022) Coupling Of Tree Growth And Photosynthetic Carbon Uptake Across Six North American Forests, Journal Of Geophysical Research: Biogeosciences, 127(4), . https://doi.org/10.1029/2021JG006690 |
| 2020 | Xu, B., Arain, M. A., Black, T. A., Law, B. E., Pastorello, G. Z., Chu, H. (2020) Seasonal Variability Of Forest Sensitivity To Heat And Drought Stresses: A Synthesis Based On Carbon Fluxes From North American Forest Ecosystems, Global Change Biology, 26(2), 901-918. https://doi.org/10.1111/gcb.14843 |
| 2021 | Chu, H., Luo, X., Ouyang, Z., Chan, W. S., Dengel, S., Biraud, S. C., Torn, M. S., Metzger, S., Kumar, J., Arain, M. A., Arkebauer, T. J., Baldocchi, D., Bernacchi, C., Billesbach, D., Black, T. A., Blanken, P. D., Bohrer, G., Bracho, R., Brown, S., Brunsell, N. A., Chen, J., Chen, X., Clark, K., Desai, A. R., Duman, T., Durden, D., Fares, S., Forbrich, I., Gamon, J. A., Gough, C. M., Griffis, T., Helbig, M., Hollinger, D., Humphreys, E., Ikawa, H., Iwata, H., Ju, Y., Knowles, J. F., Knox, S. H., Kobayashi, H., Kolb, T., Law, B., Lee, X., Litvak, M., Liu, H., Munger, J. W., Noormets, A., Novick, K., Oberbauer, S. F., Oechel, W., Oikawa, P., Papuga, S. A., Pendall, E., Prajapati, P., Prueger, J., Quinton, W. L., Richardson, A. D., Russell, E. S., Scott, R. L., Starr, G., Staebler, R., Stoy, P. C., Stuart-Haëntjens, E., Sonnentag, O., Sullivan, R. C., Suyker, A., Ueyama, M., Vargas, R., Wood, J. D., Zona, D. (2021) Representativeness Of Eddy-Covariance Flux Footprints For Areas Surrounding Ameriflux Sites, Agricultural And Forest Meteorology, 301-302, 108350. https://doi.org/10.1016/j.agrformet.2021.108350 |
| 2018 | Ouimette, A. P., Ollinger, S. V., Richardson, A. D., Hollinger, D. Y., Keenan, T. F., Lepine, L. C., Vadeboncoeur, M. A. (2018) Carbon Fluxes And Interannual Drivers In A Temperate Forest Ecosystem Assessed Through Comparison Of Top-Down And Bottom-Up Approaches, Agricultural And Forest Meteorology, 256-257, 420-430. https://doi.org/10.1016/j.agrformet.2018.03.017 |
| 2016 | Novick, K. A., Ficklin, D. L., Stoy, P. C., Williams, C. A., Bohrer, G., Oishi, A., Papuga, S. A., Blanken, P. D., Noormets, A., Sulman, B. N., Scott, R. L., Wang, L., Phillips, R. P. (2016) The Increasing Importance Of Atmospheric Demand For Ecosystem Water And Carbon Fluxes, Nature Climate Change, 6(11), 1023-1027. https://doi.org/10.1038/nclimate3114 |
| 2013 | Keenan, T. F., Hollinger, D. Y., Bohrer, G., Dragoni, D., Munger, J. W., Schmid, H. P., Richardson, A. D. (2013) Increase In Forest Water-Use Efficiency As Atmospheric Carbon Dioxide Concentrations Rise, Nature, 499(7458), 324-327. https://doi.org/10.1038/nature12291 |
| 2019 | Guerrieri, R., Belmecheri, S., Ollinger, S. V., Asbjornsen, H., Jennings, K., Xiao, J., Stocker, B. D., Martin, M., Hollinger, D. Y., Bracho-Garrillo, R., Clark, K., Dore, S., Kolb, T., Munger, J. W., Novick, K., Richardson, A. D. (2019) Disentangling The Role Of Photosynthesis And Stomatal Conductance On Rising Forest Water-Use Efficiency, Proceedings Of The National Academy Of Sciences, 116(34), 16909-16914. https://doi.org/10.1073/pnas.1905912116 |
| 2015 | Toomey, M., Friedl, M. A., Frolking, S., Hufkens, K., Klosterman, S., Sonnentag, O., Baldocchi, D. D., Bernacchi, C. J., Biraud, S. C., Bohrer, G., Brzostek, E., Burns, S. P., Coursolle, C., Hollinger, D. Y., Margolis, H. A., McCaughey, H., Monson, R. K., Munger, J. W., Pallardy, S., Phillips, R. P., Torn, M. S., Wharton, S., Zeri, M., Richardson, A. D. (2015) Greenness Indices From Digital Cameras Predict The Timing And Seasonal Dynamics Of Canopy-Scale Photosynthesis, Ecological Applications, 25(1), 99-115. https://doi.org/https://doi.org/10.1890/14-0005.1 |
| 2018 | Fer, I. and Kelly, R. and Moorcroft, P. R. and Richardson, A. D. and Cowdery, E. M. and Dietze, M. C. (2018) Linking Big Models To Big Data: Efficient Ecosystem Model Calibration Through Bayesian Model Emulation, Biogeosciences, 15(19), 5801-5830. https://doi.org/10.5194/bg-15-5801-2018 |
| 2018 | Helliker, B. R., Song, X., Goulden, M. L., Clark, K., Bolstad, P., Munger, J. W., Chen, J., Noormets, A., Hollinger, D., Wofsy, S., Martin, T., Baldocchi, D., Euskirchenn, E., Desai, A., Burns, S. P. (2018) Assessing The Interplay Between Canopy Energy Balance And Photosynthesis With Cellulose δ18o: Large-Scale Patterns And Independent Ground-Truthing, Oecologia, . https://doi.org/10.1007/s00442-018-4198-z |
| 2017 | Porras, R. C., Hicks Pries, C. E., McFarlane, K. J., Hanson, P. J., Torn, M. S. (2017) Association With Pedogenic Iron And Aluminum: Effects On Soil Organic Carbon Storage And Stability In Four Temperate Forest Soils, Biogeochemistry, 133(3), 333-345. https://doi.org/10.1007/s10533-017-0337-6 |
| 2013 | McFarlane, K. J., Torn, M. S., Hanson, P. J., Porras, R. C., Swanston, C. W., Callaham, M. A., Guilderson, T. P. (2013) Comparison Of Soil Organic Matter Dynamics At Five Temperate Deciduous Forests With Physical Fractionation And Radiocarbon Measurements, Biogeochemistry, 112(1-3), 457-476. https://doi.org/10.1007/s10533-012-9740-1 |
| 2007 | Richardson, A. D., Jenkins, J. P., Braswell, B. H., Hollinger, D. Y., Ollinger, S. V., Smith, M. (2007) Use Of Digital Webcam Images To Track Spring Green-Up In A Deciduous Broadleaf Forest, Oecologia, 152(2), 323-334. https://doi.org/10.1007/s00442-006-0657-z |
| 2002 | Smith, M., Ollinger, S. V., Martin, M. E., Aber, J. D., Hallett, R. A., Goodale, C. L. (2002) Direct Estimation Of Aboveground Forest Productivity Through Hyperspectral Remote Sensing Of Canopy Nitrogen, Ecological Applications, 12(5), 1286-1302. https://doi.org/10.2307/3099972 |
| 2007 | Jenkins, J., Richardson, A., Braswell, B., Ollinger, S., Hollinger, D., Smith, M. (2007) Refining Light-Use Efficiency Calculations For A Deciduous Forest Canopy Using Simultaneous Tower-Based Carbon Flux And Radiometric Measurements, Agricultural And Forest Meteorology, 143(1-2), 64-79. https://doi.org/10.1016/j.agrformet.2006.11.008 |
| 2005 | Ollinger, S. V., Smith, M. (2005) Net Primary Production And Canopy Nitrogen In A Temperate Forest Landscape: An Analysis Using Imaging Spectroscopy, Modeling And Field Data, Ecosystems, 8(7), 760-778. https://doi.org/10.1007/s10021-005-0079-5 |
| 2016 | Zscheischler, J., Fatichi, S., Wolf, S., Blanken, P., Bohrer, G., Clark, K., Desai, A., Hollinger, D., Keenan, T., Novick, K.A., Seneviratne, S.I. (2016) Short-term favorable weather conditions are an important control of interannual variability in carbon and water fluxes, Journal of Geophysical Research - Biogeosciences, 121(8), 2186-2198. https://doi.org/10.1002/2016JG003503 |
| 2016 | Wolf, S., Keenan, T.F., Fisher, J.B., Baldocchi, D.D., Desai, A.R., Richardson, A.D., Scott, R.L., Law, B.E., Litvak, M.E., Brunsell, N.A., Peters, W., van der Laan-Luijkx, I.T. (2016) Warm spring reduced carbon cycle impact of the 2012 US summer drought, Proceedings of the National Academy of Sciences, 113(21), 5880-5885. https://doi.org/10.1073/pnas.1519620113 |
US-Bar: Bartlett Experimental Forest
- Overview
- Windroses
- Data Citation
- Data Use Log
- Image Gallery
- Remote Sensing Data
- MODIS
- PhenoCam
- GeoNEX
- Publications
- BADM
BADM for This Site
Access the Biological, Ancillary, Disturbance and Metadata (BADM) information and data for this site.
BADM contain information for many uses, such as characterizing a site’s vegetation and soil, describing disturbance history, and defining instrumentation for flux processing. They complement the flux/met data.
- Download BADM for this site*
- View Site General Info for this site (Overview tab)*
- Use Online Editor to update Site General Info or DOI Authorship
- Update information about submitted data (Variable Information tool)
- More BADM resources
* Online updates are shown on the Overview tab real time. However, downloaded BADM files will not reflect those updates until they have been reviewed for QA/QC.
US-Bar: Bartlett Experimental Forest
- Overview
- Windroses
- Data Citation
- Data Use Log
- Image Gallery
- Remote Sensing Data
- MODIS
- PhenoCam
- GeoNEX
- Publications
- BADM
Wind Roses
Wind Speed (m/s)
- Wind Speed Scale: Per Site
- Wind Direction Scale (%): Per Site
- Wind Speed Scale: Non-Linear
- Wind Direction Scale (%): AmeriFlux