MX-EMg: El Mogor
- Overview
- Windroses
- Data Citation
- Data Use Log
- Image Gallery
- Remote Sensing Data
- MODIS
- PhenoCam
- GeoNEX
- Publications
- BADM
| Tower_team: | |
| PI: | Stephen H. Bullock sbullock@cicese.mx - Centro de Investigación Científica y de Educación Superior de Ensenada, Baja California |
| DataManager: | Alejandro Cueva alejandro.cueva@ecosur.mx - El Colegio de la Frontera Sur |
| Technician: | Eulogio López-Reyes elopez@cicese.mx - Centro de Investigación Científica y de Educación Superior de Ensenada, Baja California |
| Lat, Long: | 32.0298, -116.6045 |
| Elevation(m): | 409 |
| Network Affiliations: | AmeriFlux, MexFlux |
| Vegetation IGBP: | CSH (Closed Shrublands: Lands with woody vegetation less than 2 meters tall and with shrub canopy cover >60%. The shrub foliage can be either evergreen or deciduous.) |
| Climate Koeppen: | Bsh (Steppe: very cold winter) |
| Mean Annual Temp (°C): | 17 |
| Mean Annual Precip. (mm): | 281 |
| Flux Species Measured: | CO2, H2O |
| Years Data Collected: | 2008 - Present |
| Years Data Available: | AmeriFlux BASE 2015 - 2017 Data Citation |
| Data Use Policy: | AmeriFlux Legacy Policy |
| Description: | |
| URL: | — |
| Research Topics: | |
| Acknowledgment: | Site funding has been provided by CICESE, SECIHTI and CONACYT |
Copyright preference: As long as credit is given
MX-EMg: El Mogor
- Overview
- Windroses
- Data Citation
- Data Use Log
- Image Gallery
- Remote Sensing Data
- MODIS
- PhenoCam
- GeoNEX
- Publications
- BADM
Use the information below for citation of this site. See the Data Policy page for more details.
DOI(s) for citing MX-EMg data
Data Use Policy: AmeriFlux Legacy Policy
- AmeriFlux BASE: https://doi.org/10.17190/AMF/1717849
Citation: Alejandro Cueva, Eulogio López-Reyes, Stephen H. Bullock (2020), AmeriFlux BASE MX-EMg El Mogor, Ver. 1-5, AmeriFlux AMP, (Dataset). https://doi.org/10.17190/AMF/1717849
To cite BADM when downloaded on their own, use the publications below for citing site characterization. When using BADM that are downloaded with AmeriFlux BASE and AmeriFlux FLUXNET products, use the DOI citation for the associated data product.
Publication(s) for citing site characterization
- —
Acknowledgments
- —
Resources
- AmeriFlux Logos & Acknowledgments
MX-EMg: El Mogor
- Overview
- Windroses
- Data Citation
- Data Use Log
- Image Gallery
- Remote Sensing Data
- MODIS
- PhenoCam
- GeoNEX
- Publications
- BADM
This page displays the list of downloads of data for the site {{siteId}}.
Note: Results are the number of downloads to distinct data users. The Download Count column indicates the number of times the data user downloaded the data. The Version column refers to the version of the data product for the site that was downloaded by the data user.
| Date | Name | Data Product | Vers. | Intended Use | Intended Use Description | Download Count |
|---|---|---|---|---|---|---|
| {{dlObject.timeStamp}} | {{dlObject.displayName}} | {{displayProduct(dlObject.dataProduct)}} | {{dlObject.version}} | {{dlObject.intendedUse}} | {{dlObject.comment}} | {{dlObject.downloadCounter}} |
Showing {{startItem + 1}} to {{(startItem + items) > filtered.length ? filtered.length : (startItem + items)}} of {{filtered.length}} results
Showing 0 to 0 of 0 results
Not Found
Uh Oh. Something is missing. Try double checking the URL and try again.
MX-EMg: El Mogor
- Overview
- Windroses
- Data Citation
- Data Use Log
- Image Gallery
- Remote Sensing Data
- MODIS
- PhenoCam
- GeoNEX
- Publications
- BADM
| AmeriFlux Images | Add Image |
 MX-EMg
 MX-EMg footprint 2017-03-03 21:00 UTC
Keywords: semi-arid shrubland, phenocam, Baja California
Location: Mexico
View in Original Size
To download, right-click photo (Mac: control-click) and choose Save Image As
 MX-EMg
 Vegetation contrast of North- and South-facing slopes near MX-EMg
Vegetation and radiation contrasts of North-and South-facing slopes, upslope and cross-wind from MX-EMg eddy flux tower. Near Ensenada, Baja California, México. 18:06 UTC 2018-12-11.
Keywords: semi-arid shrubland, slope aspect, chaparral, matorral mediterraneo
Location: Mexico
View in Original Size
To download, right-click photo (Mac: control-click) and choose Save Image As
 MX-EMg
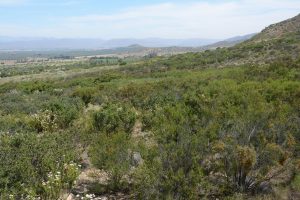
 MX-EMg fetch
253 m upwind from EC tower
Keywords: El Mogor eddy flux site, chaparral, mediterranean-climate shrubland, semi-arid, matorral esclerófilo, Baja California, Mexico
Location: Mexico
View in Original Size
To download, right-click photo (Mac: control-click) and choose Save Image As
 MX-EMg
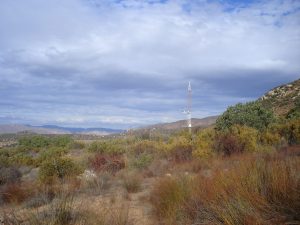
 MX-EMg tower and fetch
c.30 m upwind from EC tower November 2008
Keywords: El Mogor eddy flux site, mixed chaparral, mediterranean-climate shrubland, semi-arid, matorral esclerófilo, Baja California, Mexico
Location: Mexico
View in Original Size
To download, right-click photo (Mac: control-click) and choose Save Image As
 MX-EMg
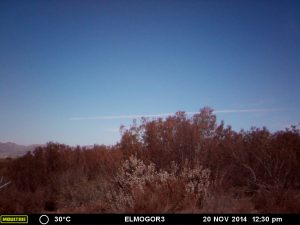
 Phenocam Image from El Mogor
This picture is from one (Mogor3) out of three wildlife cameras used as "Phenocams". The picture is from Nov 20th 2014 (start date of operation of the phenocams). This date is around the end of the dry season.
Keywords: —
Location: Mexico
View in Original Size
To download, right-click photo (Mac: control-click) and choose Save Image As
 MX-EMg
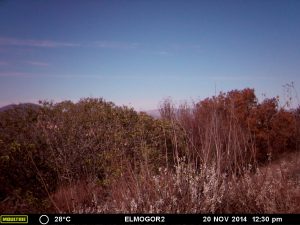
 Phenocam Image from El Mogor
This picture is from one (Mogor2) out of three wildlife cameras used as "Phenocams". The picture is from Nov 20th 2014 (start date of operation of the phenocams). This date is around the end of the dry season.
Keywords: —
Location: Mexico
View in Original Size
To download, right-click photo (Mac: control-click) and choose Save Image As
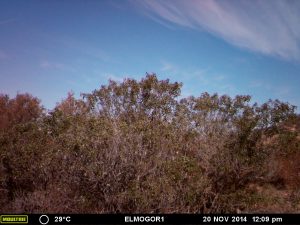 MX-EMg
 Phenocam Image from El Mogor
This picture is from one (Mogor1) out of three wildlife cameras used as "Phenocams". The picture is from Nov 20th 2014 (start date of operation of the phenocams). The dominant vegetation in this photograph is Malosma laurina.
Keywords: El Mogor; MexFlux; PhenoCam;
Location: Mexico
View in Original Size
To download, right-click photo (Mac: control-click) and choose Save Image As
MX-EMg: El Mogor
- Overview
- Windroses
- Data Citation
- Data Use Log
- Image Gallery
- Remote Sensing Data
- MODIS
- PhenoCam
- GeoNEX
- Publications
- BADM
| AmeriFlux Publications | Add Publication |
| Year | Publication |
|---|---|
| 2021 | Díaz de León-Guerrero, S., Méndez-Alonzo, R., Bullock, S.H. & Vivoni, E.R. (2021) Hydrological and topographic determinants of biomass and species richness in a Mediterranean-climate shrubland, PloS One, 16(5), . https://doi.org/10.1371/journal.pone.0252154 |
| 2020 | Cueva, A., Bullock, S. H., Méndez‐Alonzo, R., López‐Reyes, E., Vargas, R. (2020) Foliage Senescence As A Key Parameter For Modeling Gross Primary Productivity In A Mediterranean Shrubland, Journal Of Geophysical Research: Biogeosciences, . https://doi.org/10.1029/2020JG005839 |
| 2017 | Cueva, A., Bullock, S. H., López-Reyes, E., Vargas, R. (2017) Potential Bias Of Daily Soil Co2 Efflux Estimates Due To Sampling Time, Scientific Reports, 7(1), . https://doi.org/10.1038/s41598-017-11849-y |
| 2016 | Villarreal, S., Vargas, R., Yepez, E. A., Acosta, J. S., Castro, A., Escoto-Rodriguez, M., Lopez, E., Martínez-Osuna, J., Rodriguez, J. C., Smith, S. V., Vivoni, E. R., Watts, C. J. (2016) Contrasting Precipitation Seasonality Influences Evapotranspiration Dynamics In Water-Limited Shrublands, Journal Of Geophysical Research: Biogeosciences, 121(2), 494-508. https://doi.org/10.1002/2015JG003169 |
| 2014 | Leon, E., Vargas, R., Bullock, S., Lopez, E., Panosso, A. R., La Scala, N. (2014) Hot Spots, Hot Moments, And Spatio-Temporal Controls On Soil Co2 Efflux In A Water-Limited Ecosystem, Soil Biology And Biochemistry, 77, 12-21. https://doi.org/10.1016/j.soilbio.2014.05.029 |
| 2016 | Cueva, A. H., Bullock, S. H., López Reyes, E. & Vargas, R (2016) La influencia de sequía y humedad anormales en el intercambio neto de carbono en un matorral semiárido, Estado Actual del Conocimiento del Ciclo del Carbono y sus Interacciones en México: Síntesis a 2016, 37-42. |
MX-EMg: El Mogor
- Overview
- Windroses
- Data Citation
- Data Use Log
- Image Gallery
- Remote Sensing Data
- MODIS
- PhenoCam
- GeoNEX
- Publications
- BADM
BADM for This Site
Access the Biological, Ancillary, Disturbance and Metadata (BADM) information and data for this site.
BADM contain information for many uses, such as characterizing a site’s vegetation and soil, describing disturbance history, and defining instrumentation for flux processing. They complement the flux/met data.
- Download BADM for this site*
- View Site General Info for this site (Overview tab)*
- Use Online Editor to update Site General Info or DOI Authorship
- Update information about submitted data (Variable Information tool)
- More BADM resources
* Online updates are shown on the Overview tab real time. However, downloaded BADM files will not reflect those updates until they have been reviewed for QA/QC.
MX-EMg: El Mogor
- Overview
- Windroses
- Data Citation
- Data Use Log
- Image Gallery
- Remote Sensing Data
- MODIS
- PhenoCam
- GeoNEX
- Publications
- BADM
Wind Roses
Wind Speed (m/s)
- Wind Speed Scale: Per Site
- Wind Direction Scale (%): Per Site
- Wind Speed Scale: Non-Linear
- Wind Direction Scale (%): AmeriFlux

