
CA-SCC: Scotty Creek Landscape
- Overview
- Windroses
- Data Citation
- Data Use Log
- Image Gallery
- Remote Sensing Data
- MODIS
- PhenoCam
- GeoNEX
- Publications
- BADM
| Tower_team: | |
| PI: | Oliver Sonnentag oliver.sonnentag@umontreal.ca - Université de Montréal |
| DataManager: | Haley Alcock haley.alcock@umontreal.ca - Université de Montréal |
| Lat, Long: | 61.3079, -121.2992 |
| Elevation(m): | 285 |
| Network Affiliations: | AmeriFlux |
| Vegetation IGBP: | ENF (Evergreen Needleleaf Forests: Lands dominated by woody vegetation with a percent cover >60% and height exceeding 2 meters. Almost all trees remain green all year. Canopy is never without green foliage.) |
| Climate Koeppen: | Dfc (Subarctic: severe winter, no dry season, cool summer) |
| Mean Annual Temp (°C): | -2.8 |
| Mean Annual Precip. (mm): | 387.6 |
| Flux Species Measured: | CO2, H2O |
| Years Data Collected: | 2013 - Present |
| Years Data Available: | AmeriFlux BASE 2013 - 2024 Data Citation AmeriFlux FLUXNET 2013 - 2024 Data Citation |
| Data Use Policy: | AmeriFlux CC-BY-4.0 Policy1 |
| Description: | |
| URL: | http://atmosbios.com/ |
| Research Topics: | Permafrost thaw effects on land-atmosphere interactions |
| Acknowledgment: | Eddy covariance and supporting measurements at the Scotty Creek Research Station were funded by the Canada Research Chairs, Natural Sciences and Engineering Research Council Discovery Grant and various Canada Foundation for Innovation programs. We are grateful for the support of the Liidlii Kue First Nation and Jean-Marie River First Nation for their support of the Scotty Creek Research Station. |
- This site’s data can also be used under the more restrictive AmeriFlux Legacy Policy.
The AmeriFlux Legacy Policy must be followed if this site’s data are combined with data from sites that require the AmeriFlux Legacy Policy.
Copyright preference: As long as credit is given
CA-SCC: Scotty Creek Landscape
- Overview
- Windroses
- Data Citation
- Data Use Log
- Image Gallery
- Remote Sensing Data
- MODIS
- PhenoCam
- GeoNEX
- Publications
- BADM
Use the information below for citation of this site. See the Data Policy page for more details.
DOI(s) for citing CA-SCC data
Data Use Policy: AmeriFlux CC-BY-4.0 License
This site’s data can also be used under the more restrictive AmeriFlux Legacy Policy.
The AmeriFlux Legacy Policy must be followed if CA-SCC data are combined with data from sites that require the AmeriFlux Legacy Policy.
- AmeriFlux BASE: https://doi.org/10.17190/AMF/1480303
Citation: Oliver Sonnentag, William L Quinton (2025), AmeriFlux BASE CA-SCC Scotty Creek Landscape, Ver. 2-5, AmeriFlux AMP, (Dataset). https://doi.org/10.17190/AMF/1480303 - AmeriFlux FLUXNET: https://doi.org/10.17190/AMF/2469440
Citation: Oliver Sonnentag, William L Quinton (2026), AmeriFlux FLUXNET-1F CA-SCC Scotty Creek Landscape, Ver. v1.3_r1, AmeriFlux AMP, (Dataset). https://doi.org/10.17190/AMF/2469440
Find global FLUXNET datasets, like FLUXNET2015 and FLUXNET-CH4, and their citation information at fluxnet.org.
To cite BADM when downloaded on their own, use the publications below for citing site characterization. When using BADM that are downloaded with AmeriFlux BASE and AmeriFlux FLUXNET products, use the DOI citation for the associated data product.
Publication(s) for citing site characterization
- —
Acknowledgments
- —
Resources
- AmeriFlux Logos & Acknowledgments
CA-SCC: Scotty Creek Landscape
- Overview
- Windroses
- Data Citation
- Data Use Log
- Image Gallery
- Remote Sensing Data
- MODIS
- PhenoCam
- GeoNEX
- Publications
- BADM

This page displays the list of downloads of data for the site {{siteId}}.
Note: Results are the number of downloads to distinct data users. The Download Count column indicates the number of times the data user downloaded the data. The Version column refers to the version of the data product for the site that was downloaded by the data user.
| Date | Name | Data Product | Vers. | Intended Use | Intended Use Description | Download Count |
|---|---|---|---|---|---|---|
| {{dlObject.timeStamp}} | {{dlObject.displayName}} | {{displayProduct(dlObject.dataProduct)}} | {{dlObject.version}} | {{dlObject.intendedUse}} | {{dlObject.comment}} | {{dlObject.downloadCounter}} |
Showing {{startItem + 1}} to {{(startItem + items) > filtered.length ? filtered.length : (startItem + items)}} of {{filtered.length}} results
Showing 0 to 0 of 0 results
Not Found
Uh Oh. Something is missing. Try double checking the URL and try again.
CA-SCC: Scotty Creek Landscape
- Overview
- Windroses
- Data Citation
- Data Use Log
- Image Gallery
- Remote Sensing Data
- MODIS
- PhenoCam
- GeoNEX
- Publications
- BADM
| AmeriFlux Images | Add Image |
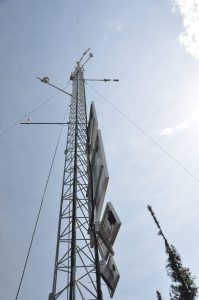
CA-SCC Scotty Creek Landscape tower
Keywords: —
Location: Northwest Territories, Canada
View in Original Size
To download, right-click photo (Mac: control-click) and choose Save Image As
CA-SCC: Scotty Creek Landscape
- Overview
- Windroses
- Data Citation
- Data Use Log
- Image Gallery
- Remote Sensing Data
- MODIS
- PhenoCam
- GeoNEX
- Publications
- BADM
| AmeriFlux Publications | Add Publication |
| Year | Publication |
|---|---|
| 2021 | Chu, H., Luo, X., Ouyang, Z., Chan, W. S., Dengel, S., Biraud, S. C., Torn, M. S., Metzger, S., Kumar, J., Arain, M. A., Arkebauer, T. J., Baldocchi, D., Bernacchi, C., Billesbach, D., Black, T. A., Blanken, P. D., Bohrer, G., Bracho, R., Brown, S., Brunsell, N. A., Chen, J., Chen, X., Clark, K., Desai, A. R., Duman, T., Durden, D., Fares, S., Forbrich, I., Gamon, J. A., Gough, C. M., Griffis, T., Helbig, M., Hollinger, D., Humphreys, E., Ikawa, H., Iwata, H., Ju, Y., Knowles, J. F., Knox, S. H., Kobayashi, H., Kolb, T., Law, B., Lee, X., Litvak, M., Liu, H., Munger, J. W., Noormets, A., Novick, K., Oberbauer, S. F., Oechel, W., Oikawa, P., Papuga, S. A., Pendall, E., Prajapati, P., Prueger, J., Quinton, W. L., Richardson, A. D., Russell, E. S., Scott, R. L., Starr, G., Staebler, R., Stoy, P. C., Stuart-Haëntjens, E., Sonnentag, O., Sullivan, R. C., Suyker, A., Ueyama, M., Vargas, R., Wood, J. D., Zona, D. (2021) Representativeness Of Eddy-Covariance Flux Footprints For Areas Surrounding Ameriflux Sites, Agricultural And Forest Meteorology, 301-302, 108350. https://doi.org/10.1016/j.agrformet.2021.108350 |
| 2017 | Helbig, M., Chasmer, L. E., Desai, A. R., Kljun, N., Quinton, W. L., Sonnentag, O. (2017) Direct And Indirect Climate Change Effects On Carbon Dioxide Fluxes In A Thawing Boreal Forest-Wetland Landscape, Global Change Biology, 23(8), 3231-3248. https://doi.org/10.1111/gcb.13638 |
CA-SCC: Scotty Creek Landscape
- Overview
- Windroses
- Data Citation
- Data Use Log
- Image Gallery
- Remote Sensing Data
- MODIS
- PhenoCam
- GeoNEX
- Publications
- BADM
BADM for This Site
Access the Biological, Ancillary, Disturbance and Metadata (BADM) information and data for this site.
BADM contain information for many uses, such as characterizing a site’s vegetation and soil, describing disturbance history, and defining instrumentation for flux processing. They complement the flux/met data.
- Download BADM for this site*
- View Site General Info for this site (Overview tab)*
- Use Online Editor to update Site General Info or DOI Authorship
- Update information about submitted data (Variable Information tool)
- More BADM resources
* Online updates are shown on the Overview tab real time. However, downloaded BADM files will not reflect those updates until they have been reviewed for QA/QC.
CA-SCC: Scotty Creek Landscape
- Overview
- Windroses
- Data Citation
- Data Use Log
- Image Gallery
- Remote Sensing Data
- MODIS
- PhenoCam
- GeoNEX
- Publications
- BADM
Wind Roses
Wind Speed (m/s)
- Wind Speed Scale: Per Site
- Wind Direction Scale (%): Per Site
- Wind Speed Scale: Non-Linear
- Wind Direction Scale (%): AmeriFlux