
BR-CMT: Capuaba farm Mato Grosso
- Overview
- Windroses
- Data Citation
- Data Use Log
- Image Gallery
- Remote Sensing Data
- MODIS
- PhenoCam
- GeoNEX
- Publications
- BADM
| Tower_team: | |
| PI: | Mark Johnson mark.johnson@ubc.ca - University of British Columbia |
| AncContact: | Laura Morillas lmorillas@eoas.ubc.ca - University of British Columbia |
| DataManager: | Brenda d'Acunha bdacunha@eoas.ubc.ca - University of British Columbia |
| Lat, Long: | -13.2875, -56.0882 |
| Elevation(m): | 427 |
| Network Affiliations: | AmeriFlux |
| Vegetation IGBP: | CRO (Croplands: Lands covered with temporary crops followed by harvest and a bare soil period (e.g., single and multiple cropping systems). Note that perennial woody crops will be classified as the appropriate forest or shrub land cover type.) |
| Climate Koeppen: | Aw (Tropical savanna) |
| Mean Annual Temp (°C): | 26.8 |
| Mean Annual Precip. (mm): | 1566 |
| Flux Species Measured: | CO2, H, H2O |
| Years Data Collected: | 2015 - 2019 |
| Years Data Available: | No data available |
| Data Use Policy: | AmeriFlux Legacy Policy |
| Description: | |
| URL: | — |
| Research Topics: | Crop modeling, rainfed vs. irrigated soybean water use |
| Acknowledgment: | Supported by AgWIT project with funding through NSERC via Water JPI and FACCEJPI Joint Call 2016 |
| Supported by grant number G8PJ-437376- 2012 (Belmont) and WTWPJ 506082-2016 (NSERC) |
Copyright preference: As long as credit is given
BR-CMT: Capuaba farm Mato Grosso
- Overview
- Windroses
- Data Citation
- Data Use Log
- Image Gallery
- Remote Sensing Data
- MODIS
- PhenoCam
- GeoNEX
- Publications
- BADM
Use the information below for citation of this site. See the Data Policy page for more details.
DOI(s) for citing BR-CMT data
Data Use Policy: AmeriFlux Legacy Policy
- No DOIs available for BR-CMT
To cite BADM downloaded as a BIF file, use the publications listed below.
Publication(s) for citing site characterization
- —
Acknowledgments
- —
Resources
- AmeriFlux Logos & Acknowledgments
BR-CMT: Capuaba farm Mato Grosso
- Overview
- Windroses
- Data Citation
- Data Use Log
- Image Gallery
- Remote Sensing Data
- MODIS
- PhenoCam
- GeoNEX
- Publications
- BADM

This page displays the list of downloads of data for the site {{siteId}}.
Note: Results are the number of downloads to distinct data users. The Download Count column indicates the number of times the data user downloaded the data. The Version column refers to the version of the data product for the site that was downloaded by the data user.
| Date | Name | Data Product | Vers. | Intended Use | Intended Use Description | Download Count |
|---|---|---|---|---|---|---|
| {{dlObject.timeStamp}} | {{dlObject.displayName}} | {{displayProduct(dlObject.dataProduct)}} | {{dlObject.version}} | {{dlObject.intendedUse}} | {{dlObject.comment}} | {{dlObject.downloadCounter}} |
Showing {{startItem + 1}} to {{(startItem + items) > filtered.length ? filtered.length : (startItem + items)}} of {{filtered.length}} results
Showing 0 to 0 of 0 results
Not Found
Uh Oh. Something is missing. Try double checking the URL and try again.
BR-CMT: Capuaba farm Mato Grosso
- Overview
- Windroses
- Data Citation
- Data Use Log
- Image Gallery
- Remote Sensing Data
- MODIS
- PhenoCam
- GeoNEX
- Publications
- BADM
| AmeriFlux Images | Add Image |
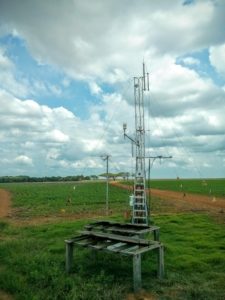
BR-CMT Capuaba farm flux site (Mato Grosso)
This photo shows the eddy covariance system at the beginning of the soybean development cycle (November 2016)
Keywords: soybean, Mato Grosso,
Location: Brazil
View in Original Size
To download, right-click photo (Mac: control-click) and choose Save Image As
BR-CMT: Capuaba farm Mato Grosso
- Overview
- Windroses
- Data Citation
- Data Use Log
- Image Gallery
- Remote Sensing Data
- MODIS
- PhenoCam
- GeoNEX
- Publications
- BADM
| AmeriFlux Publications | Add Publication |
| Year | Publication |
|---|---|
| 2018 | Lathuillière, M.J., Dalmagro, H.J., Black, T.A., Arruda, P.H., Hawthorne, I., Couto, E.G., Johnson, M.S. (2018) Rain-fed and irrigated cropland-atmosphere water fluxes and their implications for agricultural production in Southern Amazonia, Agricultural and Forest Meteorology, 256-257, 407-419. https://doi.org/10.1016/j.agrformet.2018.03.023 |
BR-CMT: Capuaba farm Mato Grosso
- Overview
- Windroses
- Data Citation
- Data Use Log
- Image Gallery
- Remote Sensing Data
- MODIS
- PhenoCam
- GeoNEX
- Publications
- BADM
BADM for This Site
Access the Biological, Ancillary, Disturbance and Metadata (BADM) information and data for this site.
BADM contain information for many uses, such as characterizing a site’s vegetation and soil, describing disturbance history, and defining instrumentation for flux processing. They complement the flux/met data.
- Download BADM for this site*
- View Site General Info for this site (Overview tab)*
- Use Online Editor to update Site General Info or DOI Authorship
- Update information about submitted data (Variable Information tool)
- More BADM resources
* Online updates are shown on the Overview tab real time. However, downloaded BADM files will not reflect those updates until they have been reviewed for QA/QC.
BR-CMT: Capuaba farm Mato Grosso
- Overview
- Windroses
- Data Citation
- Data Use Log
- Image Gallery
- Remote Sensing Data
- MODIS
- PhenoCam
- GeoNEX
- Publications
- BADM