
We had no idea we would be able to keep our flux towers operational for now more than 20 years when we began in the spring of 2001 at Mead, NE on the University of Nebraska Eastern Nebraska Research, Extension and Education Center (ENREEC) facility. However, we had a team of interdisciplinary scientists including agronomists, soil scientists, micrometeorologists all working to determine if we could manage these irrigated and rainfed agro-ecosystems to sequester carbon. One gem of data we have hidden in all the flux data we have analyzed and published on AmeriFlux is our record of mean CO2 concentrations. In addition to measuring eddy covariance CO2 fluxes, we knew it was important to measure the storage of CO2 below the tower.
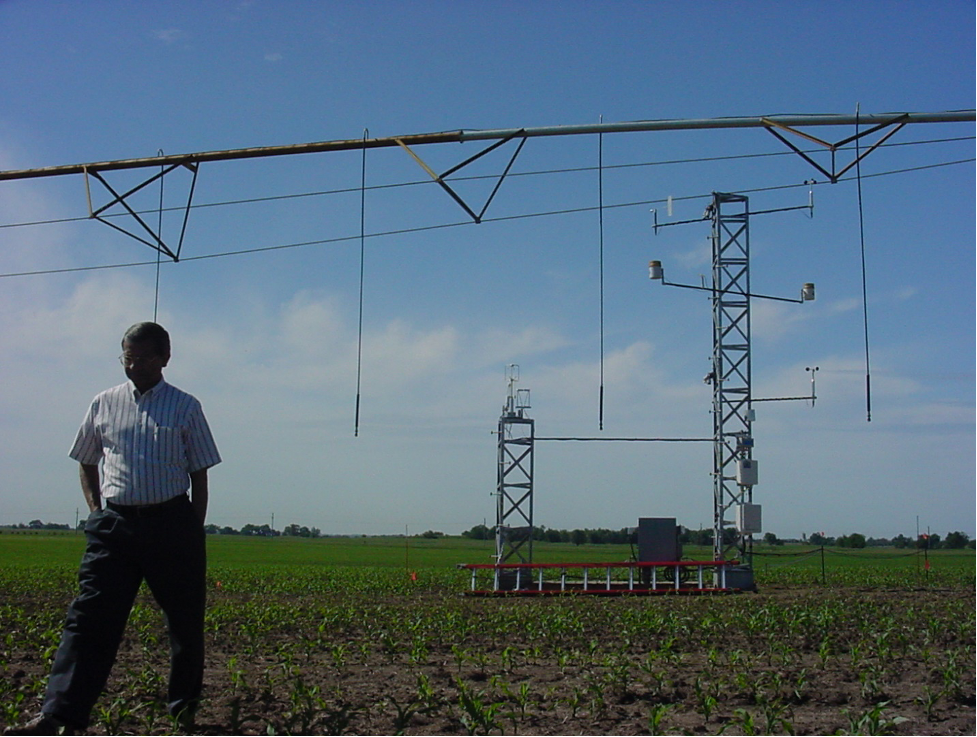
Figure 1. Dr. Shashi Verma standing at the “newly” installed flux towers at US-Ne1 around June 2021. The modified center pivot is also in the background.
When we began in 2001, we had a small, thermoelectric-cooled, apartment size fridge in which we crammed inside two LiCor-6262 CO2/H2O closed-path IRGA’s. One sensor had a flowrate through its sample cell of about 10 liters per minute, which was measuring the eddy covariance flux. The other analyzer had a flowrate of about 3 liters per minute and was sampling mean CO2 concentrations at 4 different heights. These analyzers required a slow stream of N2 to purge their reference cell to have an absolute reading of CO2 concentration. In addition to this gas, we had another cylinder of around 380 ppm. From 1 to 5 minutes after midnight each night, a datalogger program opened a series of solenoid valves and we flowed the N2 gas and the known CO2 gas to “field calibrate” both CO2 sensors. Dr. Shashi Verma, now retired but shown in Figure 1 in front of our tower at US-Ne1 way back in 2001, thought this process was so important to have confidence that the CO2 analyzers were working properly. And this procedure and output which we checked almost daily, helped us to spot problems with those sensors we may have missed otherwise. What we developed, was a fairly robust set of mean CO2 concentrations over a 13 year period.
I would like to show you some of those data because they really show some interesting similarities and contrasts with mean CO2 concentration from the famous Mauna Loa Observatory (https://gml.noaa.gov/obop/mlo/). The Mauna Loa data show the changing background CO2 concentration but no impact of surface CO2 emissions because on top of the inactive volcano that pokes through the free troposphere (https://gml.noaa.gov/obop/mlo/), there seems to be little to no active CO2 emissions (although on the website they note some wind directions have slightly higher concentrations and these data are not included). In contrast, at the Mead sites, we are measuring very large influences of both the background CO2 concentration but also a surface impact that is swamping out the changes in background CO2.
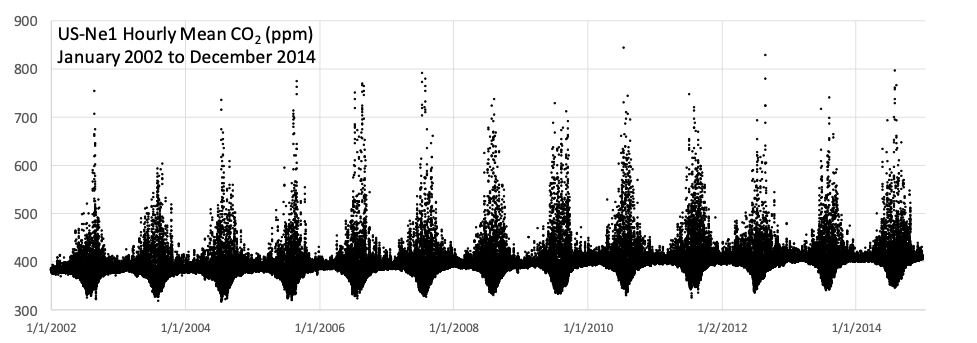
Figure 2. Mean hourly CO2 concentrations (ppm) from January 2002 to December 2014 from US-Ne1.
The second figure (Figure 2) shows hourly CO2 concentrations for 13 years measured at a height of 5.5 m above the ground. Concentrations are relatively steady in the non-growing season but show large day/night variations during the growing season. Corn was planted every year at US-Ne1 and having a C4 photosynthetic pathway (no photorespiration), it efficiently takes up carbon during the day during the latter vegetative and early reproductive growth stages. Daytime values will drop in the order of 332 to 348 ppm. At night, during calm conditions and a lot of above- and below-ground respiration, concentrations can get as high as 700-800+ ppm! With data plotted in this format, it is hard to see the changing background concentration. However, if we plot monthly average CO2 concentrations (Figure 3), similar to the Mauna Loa data format, then we see a very distinct increasing trend. From the beginning of 2002 to the end of 2014, we see an annual increase of 2.4 ppm per year. However, unlike the Mauna Loa data, we don’t see the annual fluctuation in CO2 concentrations.
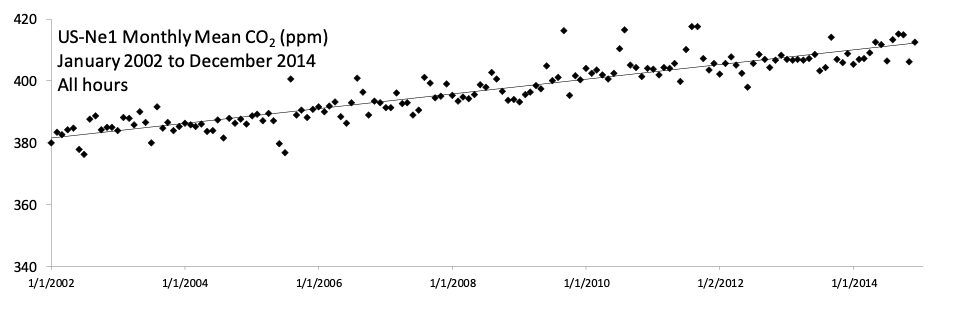
Figure 3. Mean monthly CO2 concentrations (ppm) from January 2002 to December 2014 from US-Ne1.
The draw-down of CO2 concentration in the northern hemisphere corresponds with the growing season in this half of the globe. So, from our data, if we eliminate the nighttime values and just look at midday concentrations (10 am to 4 pm LST), how does that change the averages? That result is shown in Figure 4 and here we include the monthly Mauna Loa (flask) data (Lan et al, 2022). Now we see US- Ne1 crop does significantly draw down CO2 concentration during the growing season. This draw down is of course much stronger than we see at the Mauna Loa site, as expected. It also occurs about 2 months earlier than at the Mauna Loa Observatory. We are seeing a strong impact of changing surface conditions in the footprint while the Hawaiian site, given its elevation, is measuring tropospheric CO2 concentrations which reflect the greening up and senescing of vegetation in the northern hemisphere. During this period, the Mauna Loa values increase linearly at 2.0 ppm/yr compared to 2.1 ppm/yr from US-Ne1 midday data.
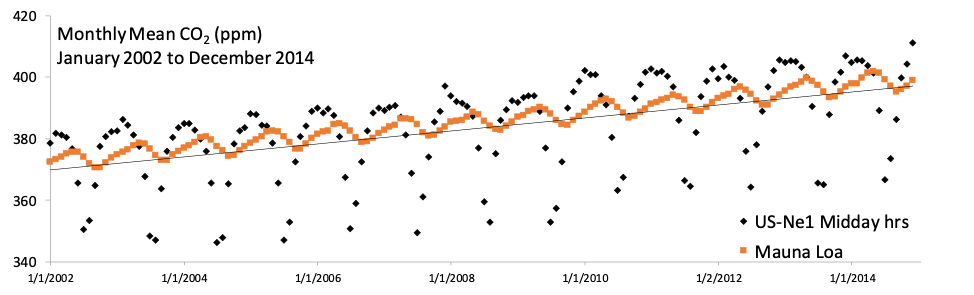
Figure 4. Mean monthly CO2 concentrations (ppm) from January 2002 to December 2014 from US-Ne1 only during midday hours and flask CO2 concentration data for the same period from the Mauna Loa observatory.
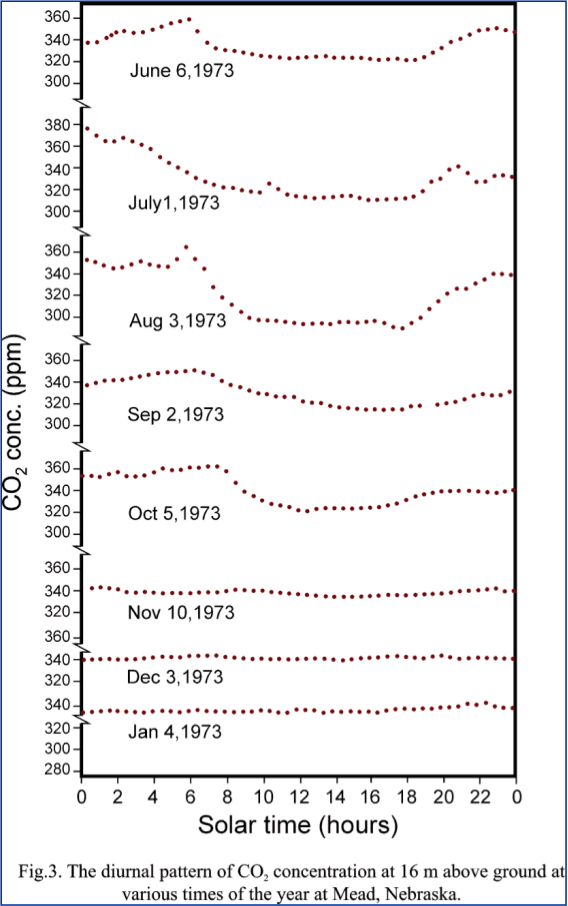
Figure 5. From Verma and Rosenberg (1976), half hourly CO2 concentrations made at 16 m above the ground in 1973 at a location less than 2 km from US-Ne1.
Finally, to contrast our US-Ne1 values from concentration data collected in 1973 (Verma and Rosenberg, 1976) at a site less than 2 km away, we see during the growing season, CO2 concentrations 16 m above the ground were sub 300 ppm (Figure 5) and during the winter, reached only 340 ppm. How far we have risen in the last 40 years!
Lan, X., E.J. Dlugokencky, J.W. Mund, A.M. Crotwell, M.J. Crotwell, E. Moglia, M. Madronich, D. Neff and K.W. Thoning (2022), Atmospheric Carbon Dioxide Dry Air Mole Fractions from the NOAA GML Carbon Cycle Cooperative Global Air Sampling Network, 1968-2021, Version: 2022-07-28, https://doi.org/10.15138/wkgj-f215
Verma, S.B. and J. Rosenberg 1976 Carbon dioxide concentration and flux in a large agricultural region of the great plains of North America. Journal of Geophysical Research, 81(3), 399-405, 10.1029/JC081i003p00399
Funding
We gratefully acknowledge funding from multiple agencies through the years including DOE – Office of Science, NASA, The AmeriFlux Management Project, and the Nebraska Agricultural Experiment Station with funding from the Hatch Act (Accession Number 1020768) through the USDA National Institute of Food and Agriculture.
No Comments
Be the first to start a conversation