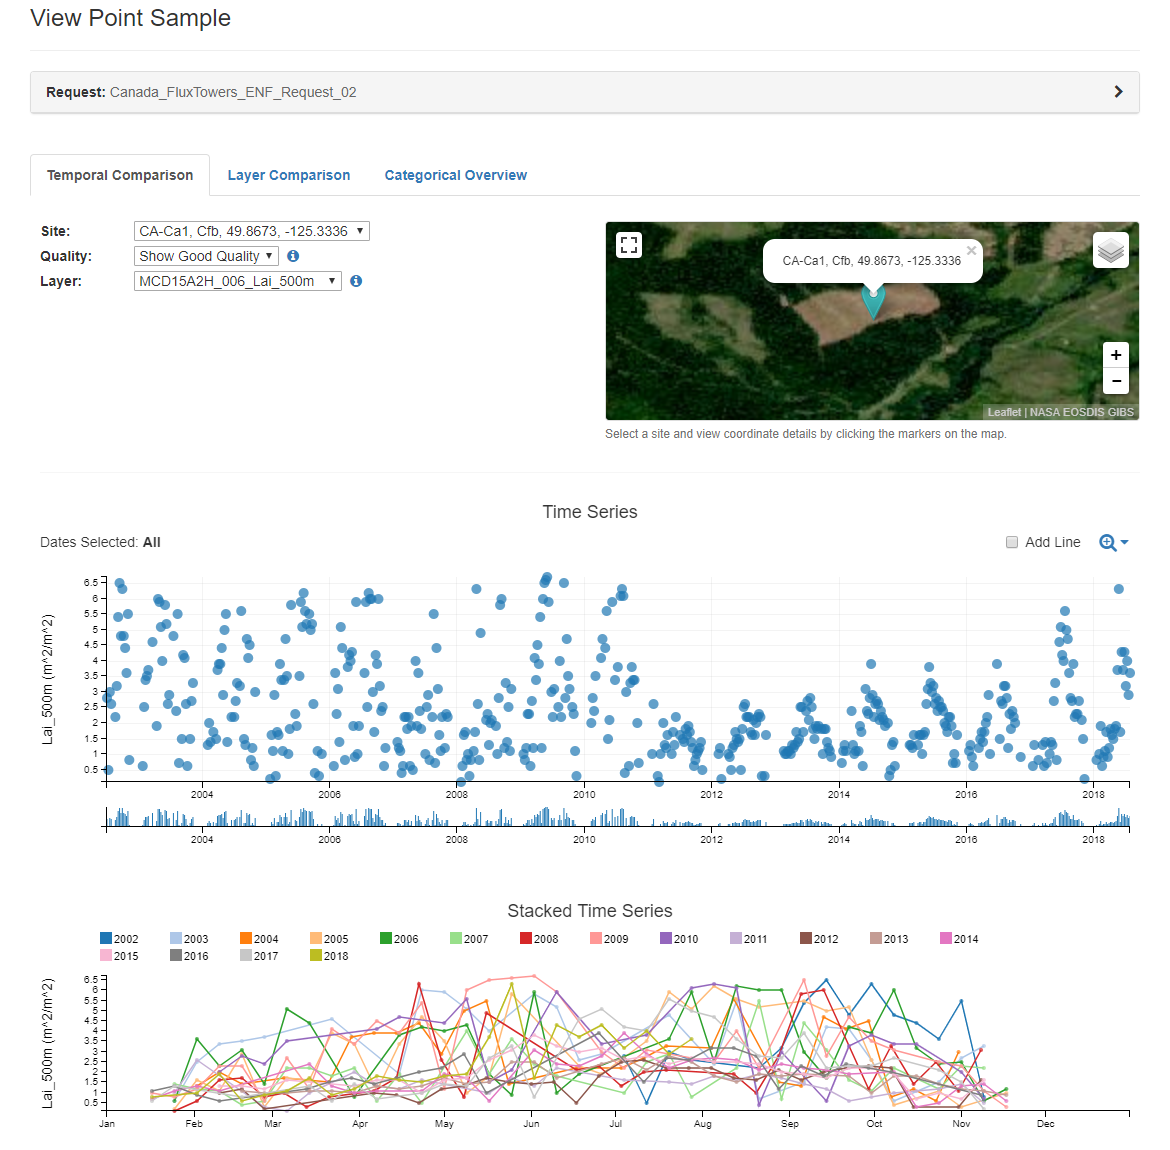
Figure 3: AppEEARS exploratory data visualization of LAI (MCD15A2H.006) from 2002 to 2018 at Ameriflux Site CA-Ca1. The scatterplot shows a sharp decrease in LAI between 2010 and 2011

Figure 3: AppEEARS exploratory data visualization of LAI (MCD15A2H.006) from 2002 to 2018 at Ameriflux Site CA-Ca1. The scatterplot shows a sharp decrease in LAI between 2010 and 2011
No Comments
Be the first to start a conversation