
It’s not often that you get to see a total solar eclipse from your own back yard. It’s even rarer when your eddy covariance flux site, 300 miles away, is also in the path of totality. That’s just the situation we found ourselves in. On August 21, 2017, a total solar eclipse crossed our research site in the Nebraska SandHills (US-SdH). Being a long-time amateur astronomer, it presented an opportunity that we just couldn’t miss.
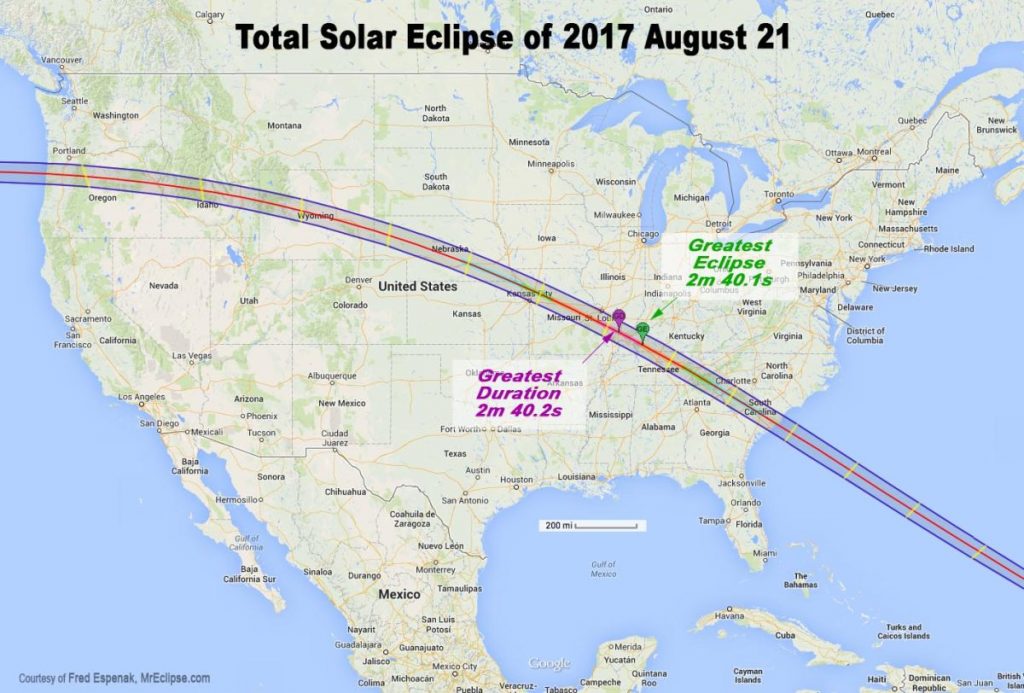
Path of the 2017 total solar eclipse
To the best of our knowledge, no other eddy covariance site (in the U.S. at least) has ever had the opportunity to make these kind of measurements. Our site is in the middle of a vast grassland ecosystem that sits atop one of the largest aquifers in the U.S. The grasses stabilize what would otherwise be mobile sand dunes, and are able to access the water contained below the surface. Since the event had been accurately predicted long in advance, we had plenty of time to plan for it. While few if any astronomers considered what effect a total solar eclipse would have on the vegetative canopy, it was exactly the question (or questions) that we hoped we could answer.
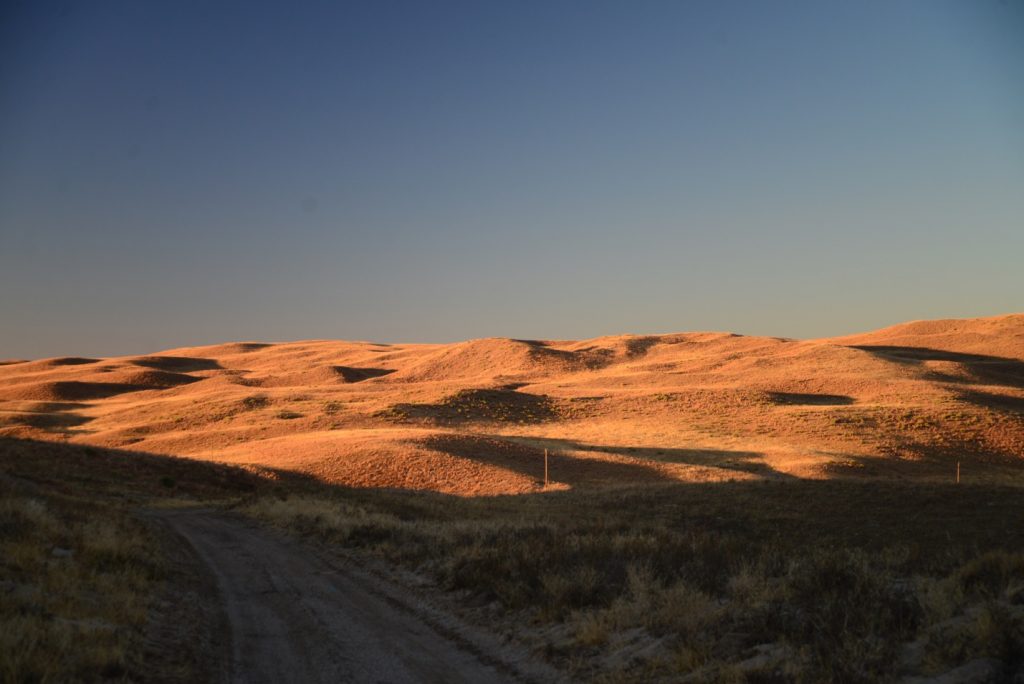
Nebraska SandHills
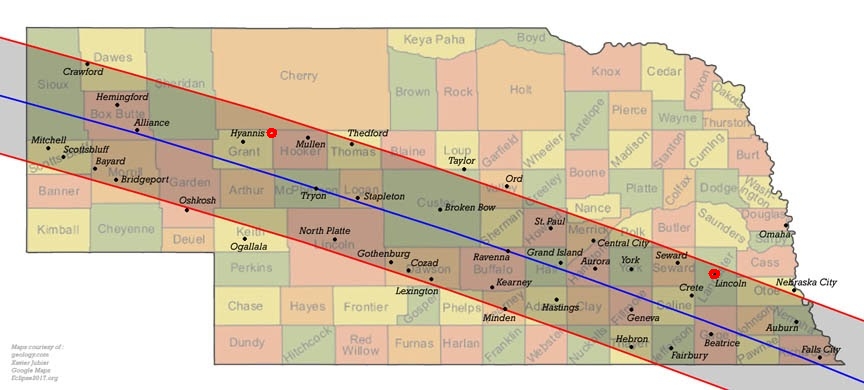
Our research site is the red dot at upper left and Lincoln is the red dot at lower right.
Would the photosynthizing canopy react immediately to the reduction in sunlight? Would other ecosystem fluxes also respond? What other observable effects could we measure? While there are a few reports of the effects a solar eclipse has on atmospheric variables, we weren’t aware of any dealing with the response of a plant canopy to such an event. After thinking about these aspects, we planned what modifications to make to our data collection systems to maximize their usefulness. Our main consideration was the time frame of the eclipse. The astronomical effects of the eclipse would last for several hours; however the rare totality would be less than 2 minutes at our site. Our primary eddy covariance instruments (sonic anemometer and open path IRGA) collected data at 10 samples per second, so that raw data stream would be adequate. Data from our “slow response” instruments, on the other hand, were being averaged and stored only once every 30 minutes. This would completely smear out the totality event, so we modified our system to average and record data every 10 seconds. After a couple of last minute trips to the site to insure that everything was operating properly, we relaxed back home in Lincoln, and waited for the big day. On the day of the eclipse, we and many many friends and relatives gathered to watch. The day started out with a lot of broken clouds, and we were afraid that maybe we’d be out of luck. Fortunately, the clouds relented and we were all treated to the spectacle of a lifetime.
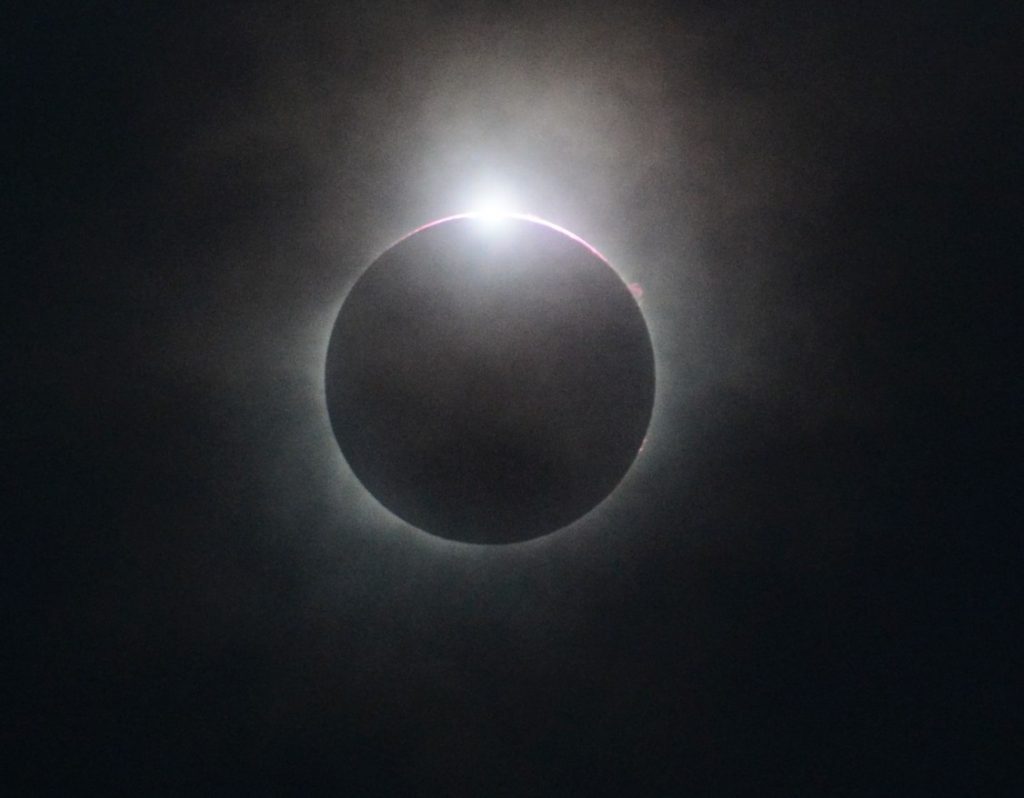
The Diamond Ring. Sunlight peeking through a gap between Lunar mountains.
We were in awe. Comments came from everyone. “I can feel it getting cold.” “It looks like sunset on the horizon in every direction.” “The birds have all gotten quiet.” “WOW!” We were thrilled at what we had seen, but the question remained of whether or not our instruments (300 miles to the northwest) had seen it too. After retrieving our raw data, and having a quick look at what our radiometers had recorded, we knew that as in Lincoln, the clouds had cooperated at our site. Our slow response data required little if any post-processing, but we were faced with how to preserve the aspects of totality in the fluxes that we had yet to generate from our fast response instruments. Typically, eddy covariance data are processed into 30-minute blocks. These averages usually guarantee that all of the cospectral energy contributing to the fluxes is retained. This however would not give us much information about the total phase of the eclipse. So, we decided to CHEAT! We generated fluxes for averaging times of 1, 5, 15, and 30 minutes. While the shorter times wouldn’t be representative of our normal footprint, they would give a better idea of how a reduced footprint responded to totality. In the end, we settled on 5 minutes as the shortest practical averaging time. What did we see? The following graphs show the most interesting aspects of the event. For reference, the times are UCT, and totality occurred at Time Of Year 233.55
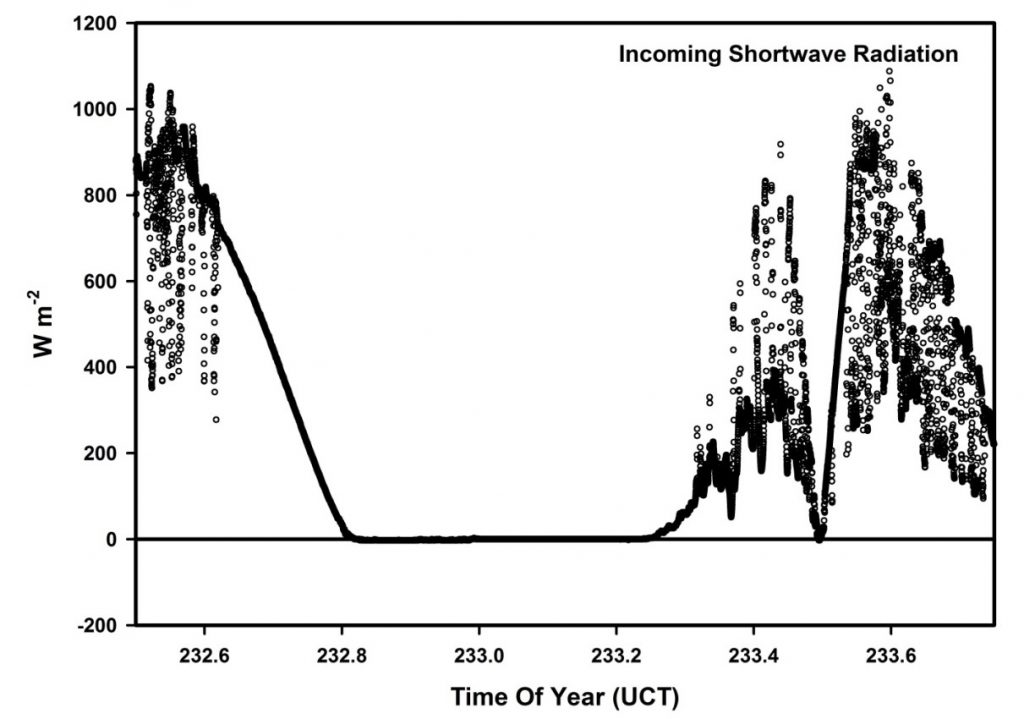
Incoming (downwelling) shortwave radiation
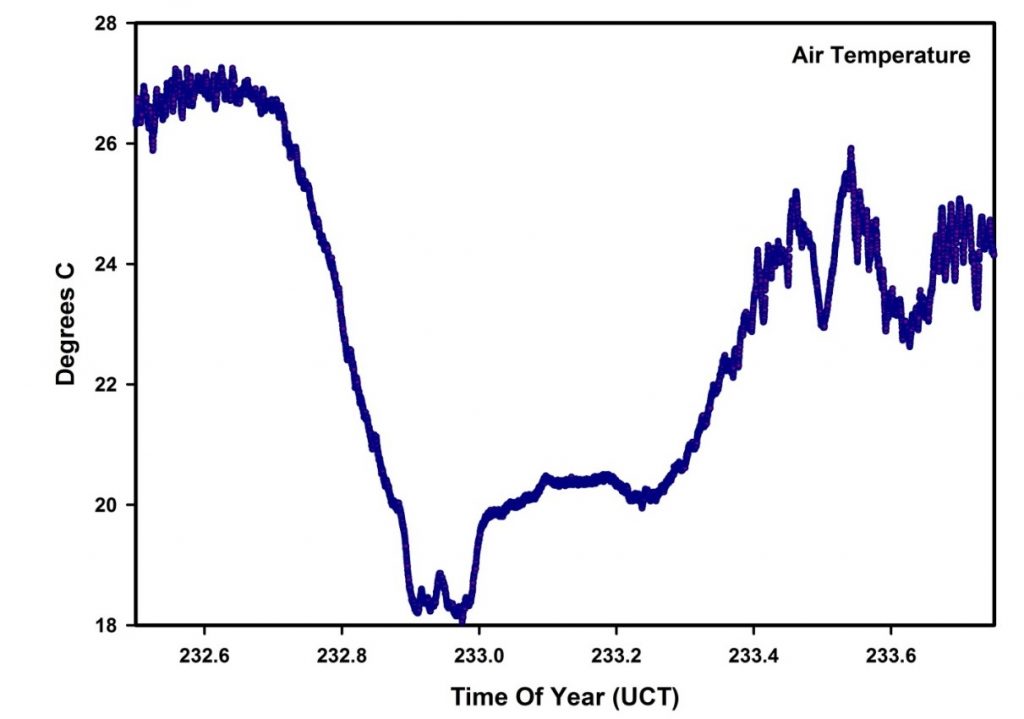
Air temperature
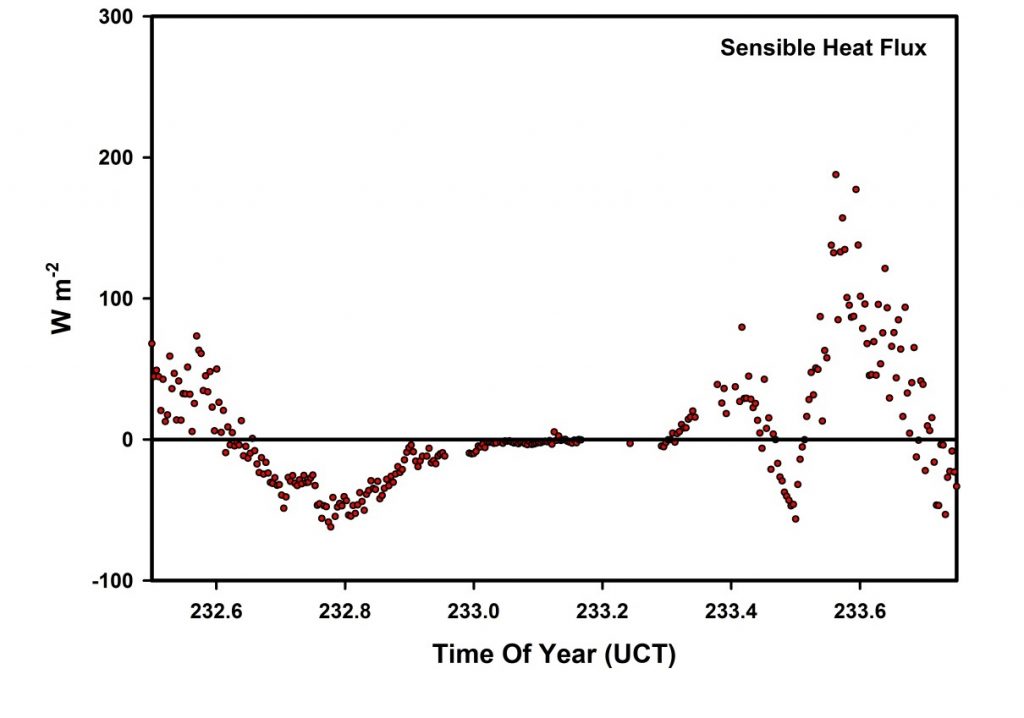
Sensible heat flux
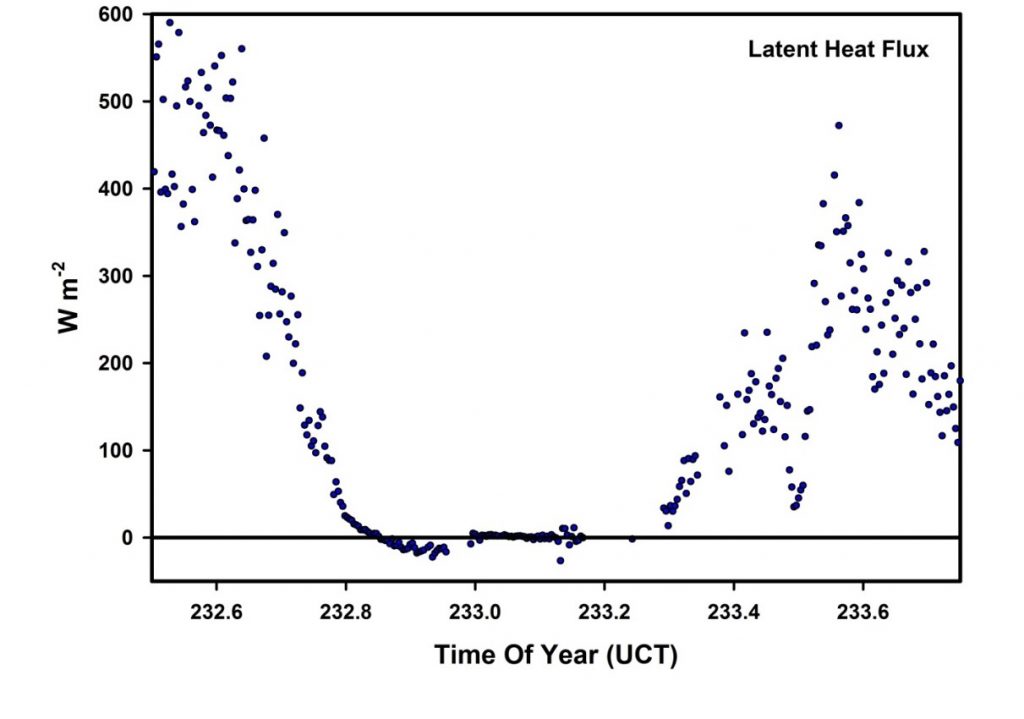
Latent heat flux
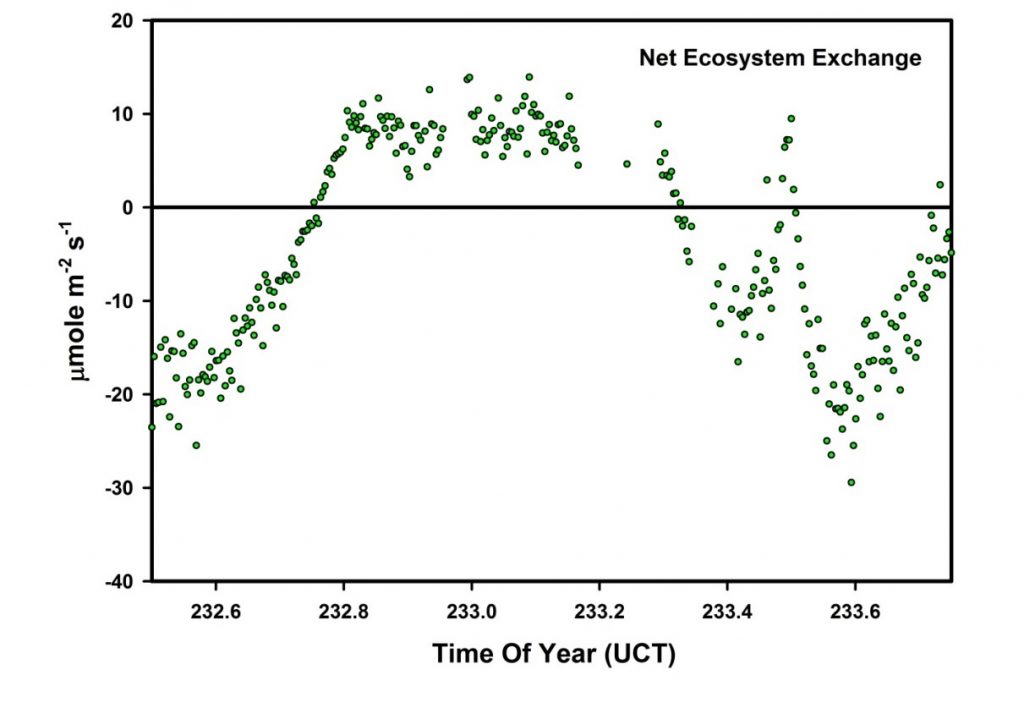
Net Ecosystem Exchange
We saw an almost 2 degree drop in air temperature as well as distinct decreases in both sensible and latent heat fluxes. The plot of net ecosystem exchange shows that photosynthesis was drastically reduced, and may have shut down altogether. At totality, the measured CO2 flux had returned almost to the same value that it had the previous night, suggesting that only soil respiration was active. After totality, all of these quantities returned to their daytime values as more and more sunlight became available while the moon moved on in its orbit. We saw similar behavior in soil temperatures and soil heat fluxes, although there was some time lag in these (depending on the depth of the measurement), and the sharp inflection at totality was rounded off.
None of these results are surprising, but we think that these are among the first measured ecosystem fluxes obtained during a total solar eclipse. There were several other AmeriFlux sites that experienced this event, and no doubt there are other data sets available. Hopefully when the next total solar eclipse tracks across the U.S. (April 8, 2024), more flux sites will record the event.
What would we do differently? One unique aspect of this darkening of the sky may be the spectral quality of the light. During sunrise and sunset, solar radiation reaching the Earth’s surface is reddened considerably by its long path through the atmosphere. During an eclipse, the sun may be high in the sky, and the darkening will not be accompanied by this spectral shift to longer wavelengths. Hyperspectral radiometry, combined with eddy covariance measurements may prove interesting. We don’t know for sure, but we’ve got a little more than 3 years to plan!
A shorter version of this piece appeared in the December, 2020 issue of Sky & Telescope (https://skyandtelescope.org/sky-and-telescope-magazine/inside-the-december-2020-issue/)
No Comments
Be the first to start a conversation