
We can see our data at the click of a button. Frequent and fast data checks are essential for maintaining our flux tower sites. Whether via a comfy remote connection or soon after a trip to the site, checking the data as it comes in allows us to detect issues and quickly plan for repairs. Nothing is worse than investing loads of time into a site only to find at the end of the year that a sensor went down in February. Even knowing how important data checks are, all the other responsibilities can make it hard to keep up with the data. Our lab needed something that was extremely low effort and easy to share with students for data checks and training.
I find that visual checks are best for detecting issues. Our brains are excellent at finding patterns and detecting deviations or unusual behavior, even at a quick glance. I had a small amount of experience developing R Shiny Apps but stumbled across R Shiny Dashboards as a slightly more accessible way to develop an interactive data tool. So, we took the codes we use for data QA/QC and thought about how we could generalize this into a list of essential variables. We wanted weekly data checks to be streamlined and in a uniform format to see the exact same variables every time. We wanted minimal erroneous information to keep it simple while still comprehensive enough for diagnosing issues and going out to the site ready for the most likely repair scenario. We also wanted informative variable names with units so that the display would be comprehensible to those less familiar with the site. After starting with one site, it was quite easy to adapt variable ID names and data formats to work for our other sites. The dashboard is an evolving tool that we can update as our needs evolve or become more sophisticated. Code for the tool can be found on our Lab GitHub page for anyone to adapt and use.
There were a few important things to know for developing a tool that would work for our sites:
- Consistent data format for all newly added files so that the data import can be generalized with no need to modify input directories or file format.
- Our list of essential variables to check.
- Which variables we’d want to align for cross-referencing (e.g., any one of the biomet variables with flux variables).
- Diagnostics that can identify issues at multiple levels from voltage of the entire system to diagnostic codes for the IRGA and Sonic Anemometer.
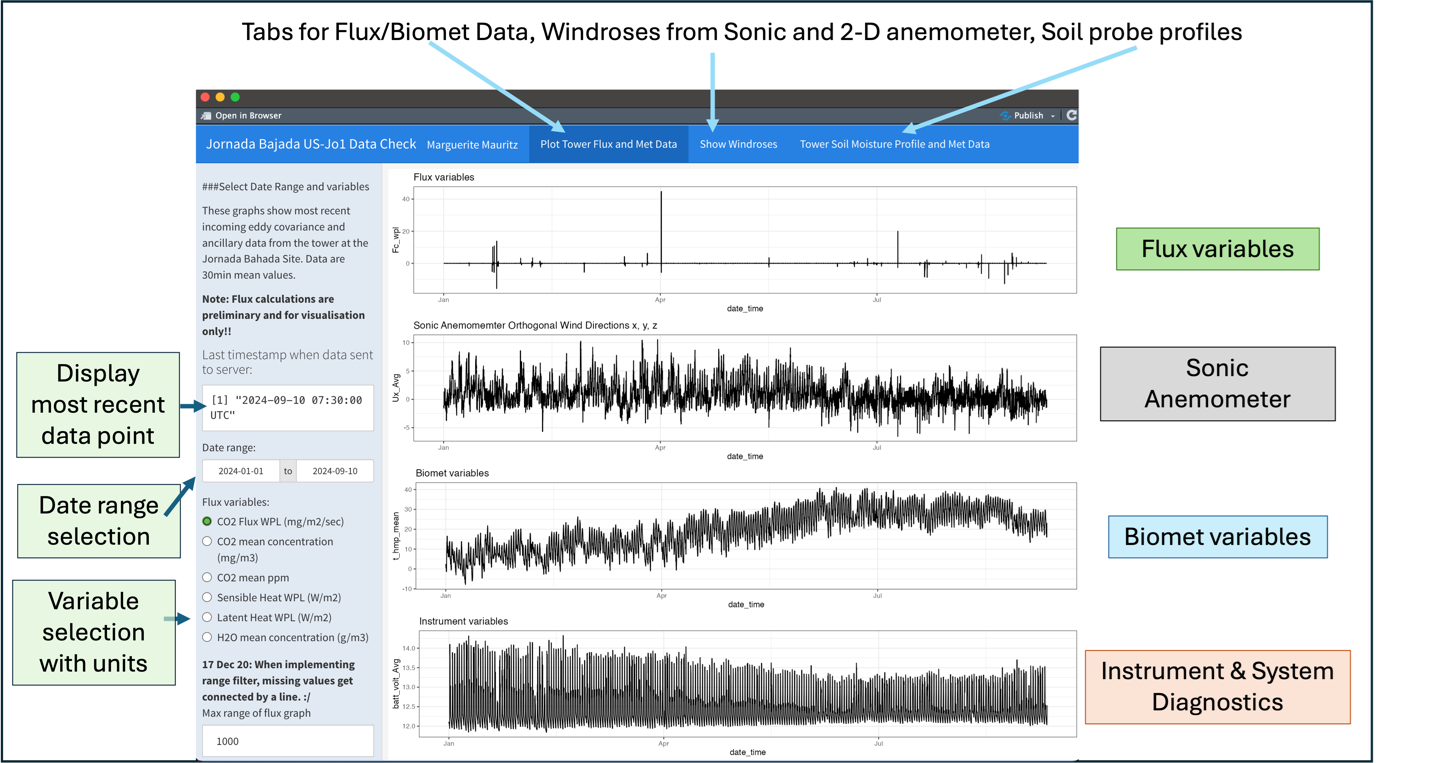
The data displays are organized roughly by data type with all panels aligned for cross comparison. Since there are a lot of sensors, data types are grouped and shown in separate tabs: Flux & Biomet; Windroses; Soil data & Biomet. Added features include prominent display of the most recent data point to check the remote connection, the ability to zoom to different day ranges, and a drop-down menu of variables with units for each measurement.
A note on R Dashboards:
R Shiny Apps or Dashboards can be daunting to develop because they require abstracting the code into generic formulas that can respond to dynamic user inputs. As with all things ‘R’, there are numerous online resources. I found this R Markdown: The Definitive Guide helpful because it includes simple worked examples. Before launching into a full dashboard design, I find it crucial to first write a simple R script that matches the abstracted structures of the dashboard. This allows me to code in some example user selections and trouble-shoot errors more quickly and directly. In the R script I can explore and understand the abstract links and then set up the dashboard input selection with a compatible logic. Always test with small, simple datasets and then build in complexity!
Contact: Marguerite Mauritz, Assistant Professor, Department of Biological Sciences, The University of Texas at El Paso (UTEP). memauritz<at>utep<dot>edu
Authors: Marguerite Mauritz, Katya Esquivel Herrera, Gesuri Ramirez, Victoria Martinez
(The Ameriflux sites at the core of this tool are part of the Dryland Critical Zone Project)
No Comments
Be the first to start a conversation