
Many BADM groups have a required and several optional STATISTIC variables. Specific examples of their use are given after an overview the variables basics.
STATISTIC Basics
BADM typically describe site-level descriptions and observations. The STATISTIC variables allow for full characterization of the reported information if desired. BADM groups, such as canopy height, LAI, soil chemistry, phenology, and biomass, contain the following STATISTIC variables:
| var_STATISTIC Required |
The type of value reported.
Options: |
| var_STATISTIC_METHOD Optional |
The method of aggregation used to generate the statistic.
Options: Statistics generated by this approach may represent spatial characteristics of the measurement within the site (e.g., spatial heterogeneity) and/or characteristics due to other factors (e.g., population variability). Aggregate of sample aggregates Statistics generated by this approach are often used to highlight the spatial characteristics within the site (i.e., the spatial heterogeneity of measurement within the site). Expert estimate See the Examples for more details. |
| var_STATISTIC_NUMBER Optional |
The number of observations used in calculating the statistic. |
STATISTIC Examples
Example 1: DBH calculated from a single sampling area
Example 2: DBH calculated from 8 plots
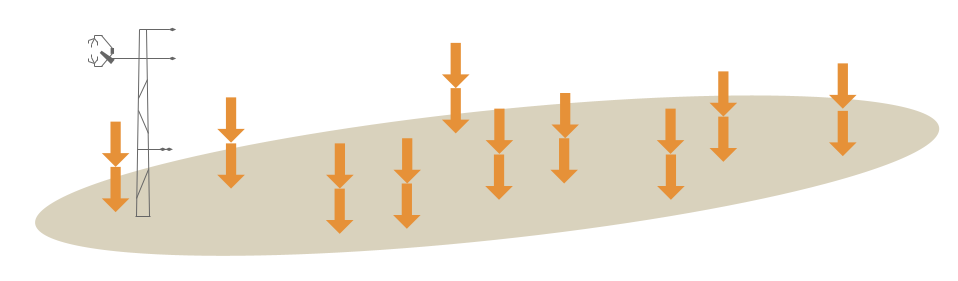
Example 3: DBH calculated from randomly selected trees within the site
Example 4: Biomass calculated from 8 plots each with 5 sub-plots
Example 5: Soil carbon calculated from replicate samples at 10 locations
Example 1: DBH calculated from a single sampling area
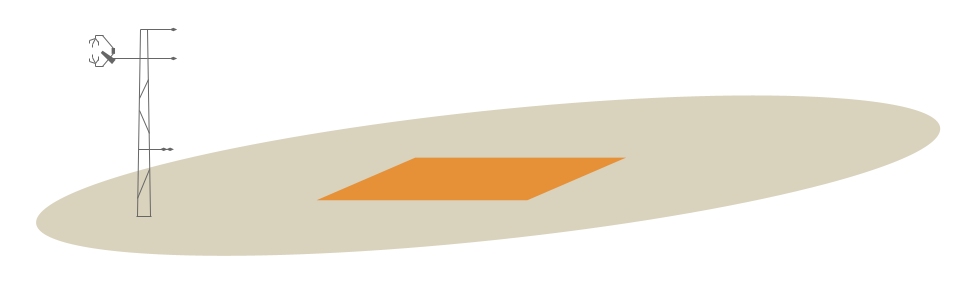
For DBH observations of individual trees in a single sample area at the site:
STATISTIC* = Mean, Minimum, Maximum, Percentiles, or Standard Deviation
STATISTIC_METHOD = Aggregate of individual observations
STATISTIC_NUMBER = # of individual samples
* Minimum, Maximum, and Percentiles should only be calculated if the sample size is adequately large.
Example 2: DBH calculated from 8 plots
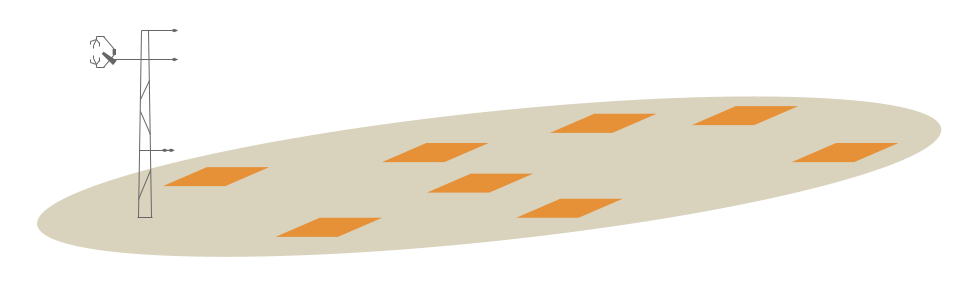
For DBH observations of individual trees in 8 sample plots at the site:
If the individual DBH observations are first aggregated at the plot level and then the plot values are are used to calculate the site-level STATISTICs to highlight spatial variability:
STATISTIC* = Mean, Minimum, Maximum, or Standard Deviation
STATISTIC_METHOD = Aggregate of sample aggregates
STATISTIC_NUMBER = 8
If the individual DBH observations are aggregated across all plots to calculate the site-level STATISTIC:
STATISTIC* = Mean, Minimum, Maximum, Percentiles, or Standard Deviation
STATISTIC_METHOD = Aggregate of individual observations
STATISTIC_NUMBER = # of individual samples
* Minimum, Maximum, and Percentiles should only be calculated if the sample size is adequately large.
Example 3: DBH calculated from randomly selected trees within the site

For DBH observations of individual trees randomly selected at the site:
STATISTIC* = Mean, Minimum, Maximum, Percentiles, or Standard Deviation
STATISTIC_METHOD = Aggregate of individual observations
STATISTIC_NUMBER = # of individual samples
* Minimum, Maximum, and Percentiles should only be calculated if the sample size is adequately large.
Example 4: Biomass calculated from 8 plots each with 5 sub-plots

For Biomass observations collected from 5 sub-plots located in each of 8 sample plots at the site:
In many cases, the sub-plot biomass observations are first aggregated at the plot level. Then the plot values are are used to calculate the site-level STATISTICs:
STATISTIC* = Mean, Minimum, Maximum, or Standard Deviation
STATISTIC_METHOD = Aggregate of sample aggregates
STATISTIC_NUMBER = 8
If pseudo-replication or spatial autocorrelation is not an issue, the sub-plot observations may be aggregated across all plots to calculate the site-level STATISTIC:
STATISTIC* = Mean, Minimum, Maximum, Percentiles, or Standard Deviation
STATISTIC_METHOD = Aggregate of individual observations
STATISTIC_NUMBER = 40
* Minimum, Maximum, and Percentiles should only be calculated if the sample size is adequately large.
Example 5: Soil carbon calculated from replicate samples at 10 locations
For replicate soil carbon observations at 10 randomly-selected points within the site:
To calculate Mean, Minimum, Maximum, Percentiles, and Standard Deviation, the replicates at each location should first be averaged. Then the average values at each location can be used to calculate the STATISTIC:
STATISTIC* = Mean, Minimum, Maximum, Percentiles, or Standard Deviation
STATISTIC_METHOD = Aggregate of sample aggregates
STATISTIC_NUMBER = 10
* Minimum, Maximum, and Percentiles should only be calculated if the sample size is adequately large.
The average difference between the replicates can be used to estimate the Measurement Uncertainty:
STATISTIC = Measurement Uncertainty
STATISTIC_METHOD = Aggregate of individual observations
STATISTIC_NUMBER = 10