Longterm trend global microbial fossilCH4_Fig2_Schwietzke2016

Long-term trend in global microbial and total fossil fuel/geological seepage CH4 emissions from 1985 to 2013. Moving averages are shown in solid black. Dark and light grey bands mark the 25th/75th percentile and the 10th/90th percentiles, respectively. Blue lines assume the mean δ13Csource values from the literature. Figure 2 in Schwietzke et al. 2016.

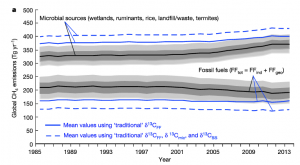
Long-term trend in global microbial and total fossil fuel/geological seepage CH4 emissions from 1985 to 2013. Moving averages are shown in solid black. Dark and light grey bands mark the 25th/75th percentile and the 10th/90th percentiles, respectively. Blue lines assume the mean δ13Csource values from the literature. Figure 2 in Schwietzke et al. 2016.