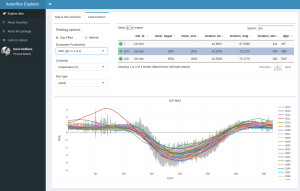
Koen Hufkens shared his implementation of a toolbox focused on exploring and visualizing AmeriFlux site data. Please see his announcement and links to his original post and the AmerifluxR software package below.
I recently finished a first iteration of AmerifluxR, a R toolbox for Ameriflux data exploration / visualization.
A quick writeup can be found on my website:
http://www.khufkens.com/2016/03/11/amerifluxr-a-r-toolbox-to-facilitate-ameriflux-level2-data-exploration/The toolbox can be downloaded by following the instructions on my github page:
http://khufkens.github.io/amerifluxr/Feature requests and bug reports can be posted on github as well. Windows support should be ok, but might contain more bugs due to more limited access to a Windows system.
I hope this is of use to some.
Cheers,
Koen
—
Dr. Koen HufkensHarvard University
Department of Organismic & Evolutionary Biology
Richardson Lab@koen_hufkens – www.khufkens.com
Find the Rhythm of Tropical Trees – www.junglerhythms.org


No Comments
Be the first to start a conversation