
US-IB2: Fermi National Accelerator Laboratory- Batavia (Prairie site)
- Overview
- Windroses
- Data Citation
- Data Use Log
- Image Gallery
- Related Data
- MODIS
- PhenoCam
- Publications
- BADM
| Tower_team: | |
| PI: | Roser Matamala matamala@anl.gov - Argonne National Laboratory |
| FluxContact: | David Cook dsgcook@prodigy.net - Argonne National Laboratory |
| Lat, Long: | 41.8406, -88.2410 |
| Elevation(m): | 226.5 |
| Network Affiliations: | AmeriFlux |
| Vegetation IGBP: | GRA (Grasslands: Lands with herbaceous types of cover. Tree and shrub cover is less than 10%. Permanent wetlands lands with a permanent mixture of water and herbaceous or woody vegetation. The vegetation can be present in either salt, brackish, or fresh water.) |
| Climate Koeppen: | Dfa (Humid Continental: humid with severe winter, no dry season, hot summer) |
| Mean Annual Temp (°C): | 9.04 |
| Mean Annual Precip. (mm): | 930.25 |
| Flux Species Measured: | CO2 |
| Years Data Collected: | 2004 - Present |
| Years Data Available: | AmeriFlux BASE 2004 - 2018 Data Citation |
| Data Use Policy: | AmeriFlux CC-BY-4.0 Policy1 |
| Description: | |
| URL: | http://www.atmos.anl.gov/FERMI/index.html |
| Research Topics: | — |
| Acknowledgment: | — |
- This site’s data can also be used under the more restrictive AmeriFlux Legacy Policy.
The AmeriFlux Legacy Policy must be followed if this site’s data are combined with data from sites that require the AmeriFlux Legacy Policy.
Copyright preference: Request for permission
US-IB2: Fermi National Accelerator Laboratory- Batavia (Prairie site)
- Overview
- Windroses
- Data Citation
- Data Use Log
- Image Gallery
- Related Data
- MODIS
- PhenoCam
- Publications
- BADM
Use the information below for citation of this site. See the Data Policy page for more details.
DOI(s) for citing US-IB2 data
Data Use Policy: AmeriFlux CC-BY-4.0 License
This site’s data can also be used under the more restrictive AmeriFlux Legacy Policy.
The AmeriFlux Legacy Policy must be followed if US-IB2 data are combined with data from sites that require the AmeriFlux Legacy Policy.
- AmeriFlux BASE: https://doi.org/10.17190/AMF/1246066
Citation: Roser Matamala (2019), AmeriFlux BASE US-IB2 Fermi National Accelerator Laboratory- Batavia (Prairie site), Ver. 8-5, AmeriFlux AMP, (Dataset). https://doi.org/10.17190/AMF/1246066
To cite BADM when downloaded on their own, use the publications below for citing site characterization. When using BADM that are downloaded with AmeriFlux BASE and AmeriFlux FLUXNET products, use the DOI citation for the associated data product.
Publication(s) for citing site characterization
- —
Acknowledgments
- —
Resources
- AmeriFlux Logos & Acknowledgments
US-IB2: Fermi National Accelerator Laboratory- Batavia (Prairie site)
- Overview
- Windroses
- Data Citation
- Data Use Log
- Image Gallery
- Related Data
- MODIS
- PhenoCam
- Publications
- BADM

This page displays the list of downloads of data for the site {{siteId}}.
Note: Results are the number of downloads to distinct data users. The Download Count column indicates the number of times the data user downloaded the data. The Version column refers to the version of the data product for the site that was downloaded by the data user.
| Date | Name | Data Product | Vers. | Intended Use | Intended Use Description | Download Count |
|---|---|---|---|---|---|---|
| {{dlObject.timeStamp}} | {{dlObject.displayName}} | {{displayProduct(dlObject.dataProduct)}} | {{dlObject.version}} | {{dlObject.intendedUse}} | {{dlObject.comment}} | {{dlObject.downloadCounter}} |
Showing {{startItem + 1}} to {{(startItem + items) > filtered.length ? filtered.length : (startItem + items)}} of {{filtered.length}} results
Showing 0 to 0 of 0 results
Not Found
Uh Oh. Something is missing. Try double checking the URL and try again.
US-IB2: Fermi National Accelerator Laboratory- Batavia (Prairie site)
- Overview
- Windroses
- Data Citation
- Data Use Log
- Image Gallery
- Related Data
- MODIS
- PhenoCam
- Publications
- BADM
| AmeriFlux Images | Add Image |
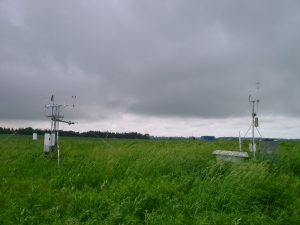
2005.US.IB2.sitevisit.IMG_1225
2005.US.IB2.sitevisit.IMG_1225
Location:
View in Original Size
To download, right-click photo (Mac: control-click) and choose Save Image As
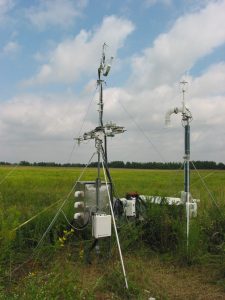
2005.US.IB2.sitevisit.IMG_1306
2005.US.IB2.sitevisit.IMG_1306
Location:
View in Original Size
To download, right-click photo (Mac: control-click) and choose Save Image As
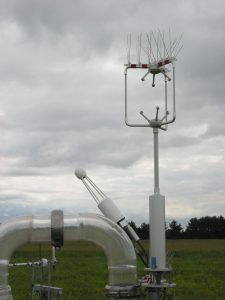
2011.Fermilab.sitevisit.DSC00046
2011.Fermilab.sitevisit.DSC00046
Location:
View in Original Size
To download, right-click photo (Mac: control-click) and choose Save Image As
US-IB2: Fermi National Accelerator Laboratory- Batavia (Prairie site)
- Overview
- Windroses
- Data Citation
- Data Use Log
- Image Gallery
- Related Data
- MODIS
- PhenoCam
- Publications
- BADM
| AmeriFlux Publications | Add Publication |
| Year | Publication |
|---|---|
| 2021 | Chu, H., Luo, X., Ouyang, Z., Chan, W. S., Dengel, S., Biraud, S. C., Torn, M. S., Metzger, S., Kumar, J., Arain, M. A., Arkebauer, T. J., Baldocchi, D., Bernacchi, C., Billesbach, D., Black, T. A., Blanken, P. D., Bohrer, G., Bracho, R., Brown, S., Brunsell, N. A., Chen, J., Chen, X., Clark, K., Desai, A. R., Duman, T., Durden, D., Fares, S., Forbrich, I., Gamon, J. A., Gough, C. M., Griffis, T., Helbig, M., Hollinger, D., Humphreys, E., Ikawa, H., Iwata, H., Ju, Y., Knowles, J. F., Knox, S. H., Kobayashi, H., Kolb, T., Law, B., Lee, X., Litvak, M., Liu, H., Munger, J. W., Noormets, A., Novick, K., Oberbauer, S. F., Oechel, W., Oikawa, P., Papuga, S. A., Pendall, E., Prajapati, P., Prueger, J., Quinton, W. L., Richardson, A. D., Russell, E. S., Scott, R. L., Starr, G., Staebler, R., Stoy, P. C., Stuart-Haëntjens, E., Sonnentag, O., Sullivan, R. C., Suyker, A., Ueyama, M., Vargas, R., Wood, J. D., Zona, D. (2021) Representativeness Of Eddy-Covariance Flux Footprints For Areas Surrounding Ameriflux Sites, Agricultural And Forest Meteorology, 301-302, 108350. https://doi.org/10.1016/j.agrformet.2021.108350 |
| 2016 | Novick, K. A., Ficklin, D. L., Stoy, P. C., Williams, C. A., Bohrer, G., Oishi, A., Papuga, S. A., Blanken, P. D., Noormets, A., Sulman, B. N., Scott, R. L., Wang, L., Phillips, R. P. (2016) The Increasing Importance Of Atmospheric Demand For Ecosystem Water And Carbon Fluxes, Nature Climate Change, 6(11), 1023-1027. https://doi.org/10.1038/nclimate3114 |
| 2014 | Matheny, A. M., Bohrer, G., Stoy, P. C., Baker, I. T., Black, A. T., Desai, A. R., Dietze, M. C., Gough, C. M., Ivanov, V. Y., Jassal, R. S., Novick, K. A., Schäfer, K. V., Verbeeck, H. (2014) Characterizing The Diurnal Patterns of Errors in The Prediction of Evapotranspiration by Several Land-Surface Models: An Nacp Analysis, Journal Of Geophysical Research: Biogeosciences, 119(7), 1458-1473. https://doi.org/10.1002/2014JG002623 |
| 2018 | Chu, H., Baldocchi, D. D., Poindexter, C., Abraha, M., Desai, A. R., Bohrer, G., Arain, M. A., Griffis, T., Blanken, P. D., O'Halloran, T. L., Thomas, R. Q., Zhang, Q., Burns, S. P., Frank, J. M., Christian, D., Brown, S., Black, T. A., Gough, C. M., Law, B. E., Lee, X., Chen, J., Reed, D. E., Massman, W. J., Clark, K., Hatfield, J., Prueger, J., Bracho, R., Baker, J. M., Martin, T. A. (2018) Temporal Dynamics Of Aerodynamic Canopy Height Derived From Eddy Covariance Momentum Flux Data Across North American Flux Networks, Geophysical Research Letters, 45, 9275–9287. https://doi.org/10.1029/2018GL079306 |
| 2015 | Dennis Baldocchi, Cove Sturtevant (2015) Does day and night sampling reduce spurious correlation between canopy photosynthesis and ecosystem respiration?, Agricultural and Forest Meteorology, 207, 117-126. https://doi.org/10.1016/j.agrformet.2015.03.010 |
| 2004 | Post, W. M., Izaurralde, R. C., Jastrow, J. D., McCarl, B. A., Amonette, J. E., Bailey, V. L., Jardine, P. M., West, T. O., Zhou, J. (2004) Enhancement Of Carbon Sequestration In US Soils, Bioscience, 54(10), 895-908. https://doi.org/10.1641/0006-3568(2004)054[0895:eocsiu]2.0.co;2 |
| 2008 | Matamala, R., Jastrow, J. D., Miller, R. M., Garten, C. T. (2008) Temporal Changes In C And N Stocks Of Restored Prairie: Implications For C Sequestration Strategies, Ecological Applications, 18(6), 1470-1488. https://doi.org/10.1890/07-1609.1 |
| 2005 | Allison, V. J., Miller, R. M., Jastrow, J. D., Matamala, R., Zak, D. R. (2005) Changes In Soil Microbial Community Structure In A Tallgrass Prairie Chronosequence, Soil Science Society Of America Journal, 69(5), 1412-1421. https://doi.org/10.2136/sssaj2004.0252 |
| 1987 | Jastrow, J. D. (1987) Changes In Soil Aggregation Associated With Tallgrass Prairie Restoration, American Journal Of Botany, 74(11), 1656-1664. https://doi.org/10.2307/2444134 |
| 1998 | Jastrow, J., Miller, R., Lussenhop, J. (1998) Contributions Of Interacting Biological Mechanisms To Soil Aggregate Stabilization In Restored Prairie, Soil Biology And Biochemistry, 30(7), 905-916. https://doi.org/10.1016/s0038-0717(97)00207-1 |
| 1996 | Jastrow, J. (1996) Soil Aggregate Formation And The Accrual Of Particulate And Mineral-Associated Organic Matter, Soil Biology And Biochemistry, 28(4-5), 665-676. https://doi.org/10.1016/0038-0717(95)00159-x |
| 2002 | Sluis, W. J. (2002) Patterns Of Species Richness And Composition In Re-Created Grassland, Restoration Ecology, 10(4), 677-684. https://doi.org/10.1046/j.1526-100x.2002.01048.x |
| 2002 | Miller, R. M., Miller, S. P., Jastrow, J. D., Rivetta, C. B. (2002) Mycorrhizal Mediated Feedbacks Influence Net Carbon Gain And Nutrient Uptake In Andropogon Gerardii, New Phytologist, 155(1), 149-162. https://doi.org/10.1046/j.1469-8137.2002.00429.x |
US-IB2: Fermi National Accelerator Laboratory- Batavia (Prairie site)
- Overview
- Windroses
- Data Citation
- Data Use Log
- Image Gallery
- Related Data
- MODIS
- PhenoCam
- Publications
- BADM
BADM for This Site
Access the Biological, Ancillary, Disturbance and Metadata (BADM) information and data for this site.
BADM contain information for many uses, such as characterizing a site’s vegetation and soil, describing disturbance history, and defining instrumentation for flux processing. They complement the flux/met data.
- Download BADM for this site*
- View Site General Info for this site (Overview tab)*
- Use Online Editor to update Site General Info or DOI Authorship
- Update information about submitted data (Variable Information tool)
- More BADM resources
* Online updates are shown on the Overview tab real time. However, downloaded BADM files will not reflect those updates until they have been reviewed for QA/QC.
US-IB2: Fermi National Accelerator Laboratory- Batavia (Prairie site)
- Overview
- Windroses
- Data Citation
- Data Use Log
- Image Gallery
- Related Data
- MODIS
- PhenoCam
- Publications
- BADM
Wind Roses
Wind Speed (m/s)
- Wind Speed Scale: Per Site
- Wind Direction Scale (%): Per Site
- Wind Speed Scale: Non-Linear
- Wind Direction Scale (%): AmeriFlux