Rigden-Salvucci_fig5_300x200

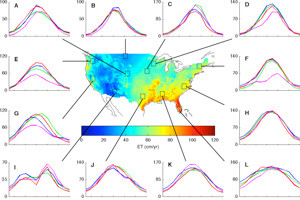
The center map shows gridded ETRHEQ ET (cm·yr−1) estimates from 1961 to 2010 across the contiguous U.S. (a—l) Climatic monthly seasonal cycles of ET (cm·yr−1) averaged over a 2° box (plotted on the map) at 12 locations. Copyright 2015 American Geophysical Union

The center map shows gridded ETRHEQ ET (cm·yr−1) estimates from 1961 to 2010 across the contiguous U.S. (a—l) Climatic monthly seasonal cycles of ET (cm·yr−1) averaged over a 2° box (plotted on the map) at 12 locations. Copyright 2015 American Geophysical Union

No Comments

Be the first to start a conversation

Leave a Reply

You must be logged in to post a comment.